
 Yahoo Finance
 The Returns At Flexible Solutions International (NYSEMKT:FSI) Provide Us With Signs Of What's To Come
What trends should we look for it we want to identify stocks that can multiply in value over the long term? Typically, we'll want to notice a trend of growing return on capital employed (ROCE) and alongside that, an expanding base of capital employed. If you see this, it typically means it's a company with a great business model and plenty of profitable reinvestment opportunities. So, when we ran our eye over Flexible Solutions International's (NYSEMKT:FSI) trend of ROCE, we liked what we saw.
Understanding Return On Capital Employed (ROCE)
Just to clarify if you're unsure, ROCE is a metric for evaluating how much pre-tax income (in percentage terms) a company earns on the capital invested in its business. The formula for this calculation on Flexible Solutions International is:
Return on Capital Employed = Earnings Before Interest and Tax (EBIT) ÷ (Total Assets - Current Liabilities)
0.14 = US$4.0m ÷ (US$34m - US$6.7m) (Based on the trailing twelve months to September 2020).
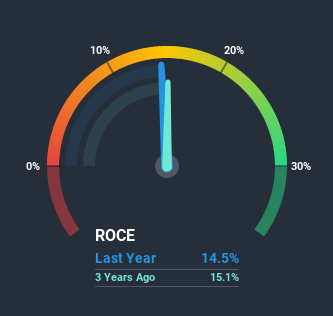
Therefore, Flexible Solutions International has an ROCE of 14%. On its own, that's a standard return, however it's much better than the 7.1% generated by the Chemicals industry.
Check out our latest analysis for Flexible Solutions International
Above you can see how the current ROCE for Flexible Solutions International compares to its prior returns on capital, but there's only so much you can tell from the past. If you're interested, you can view the analysts predictions in our free report on analyst forecasts for the company.
How Are Returns Trending?
The trend of ROCE doesn't stand out much, but returns on a whole are decent. Over the past five years, ROCE has remained relatively flat at around 14% and the business has deployed 125% more capital into its operations. Since 14% is a moderate ROCE though, it's good to see a business can continue to reinvest at these decent rates of return. Over long periods of time, returns like these might not be too exciting, but with consistency they can pay off in terms of share price returns.
On another note, while the change in ROCE trend might not scream for attention, it's interesting that the current liabilities have actually gone up over the last five years. This is intriguing because if current liabilities hadn't increased to 19% of total assets, this reported ROCE would probably be less than14% because total capital employed would be higher.The 14% ROCE could be even lower if current liabilities weren't 19% of total assets, because the the formula would show a larger base of total capital employed. With that in mind, just be wary if this ratio increases in the future, because if it gets particularly high, this brings with it some new elements of risk.
In Conclusion...
The main thing to remember is that Flexible Solutions International has proven its ability to continually reinvest at respectable rates of return. On top of that, the stock has rewarded shareholders with a remarkable 389% return to those who've held over the last five years. So while investors seem to be recognizing these promising trends, we still believe the stock deserves further research.
On a final note, we've found 2 warning signs for Flexible Solutions International that we think you should be aware of.
If you want to search for solid companies with great earnings, check out this free list of companies with good balance sheets and impressive returns on equity.
This article by Simply Wall St is general in nature. It does not constitute a recommendation to buy or sell any stock, and does not take account of your objectives, or your financial situation. We aim to bring you long-term focused analysis driven by fundamental data. Note that our analysis may not factor in the latest price-sensitive company announcements or qualitative material. Simply Wall St has no position in any stocks mentioned.
Have feedback on this article? Concerned about the content? Get in touch with us directly. Alternatively, email editorial-team (at) simplywallst.com.
