
 Yahoo Finance
 Returns On Capital Are A Standout For Ternium (NYSE:TX)
What trends should we look for it we want to identify stocks that can multiply in value over the long term? Ideally, a business will show two trends; firstly a growing return on capital employed (ROCE) and secondly, an increasing amount of capital employed. If you see this, it typically means it's a company with a great business model and plenty of profitable reinvestment opportunities. Speaking of which, we noticed some great changes in Ternium's (NYSE:TX) returns on capital, so let's have a look.
Return On Capital Employed (ROCE): What Is It?
Just to clarify if you're unsure, ROCE is a metric for evaluating how much pre-tax income (in percentage terms) a company earns on the capital invested in its business. To calculate this metric for Ternium, this is the formula:
Return on Capital Employed = Earnings Before Interest and Tax (EBIT) ÷ (Total Assets - Current Liabilities)
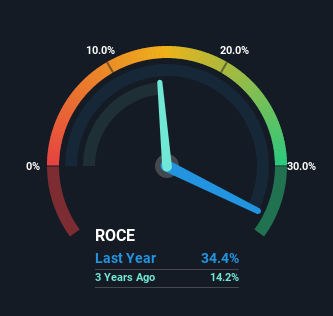
0.34 = US$5.2b ÷ (US$18b - US$2.6b) (Based on the trailing twelve months to June 2022).
So, Ternium has an ROCE of 34%. That's a fantastic return and not only that, it outpaces the average of 21% earned by companies in a similar industry.
Check out our latest analysis for Ternium
In the above chart we have measured Ternium's prior ROCE against its prior performance, but the future is arguably more important. If you'd like to see what analysts are forecasting going forward, you should check out our free report for Ternium.
What Can We Tell From Ternium's ROCE Trend?
The trends we've noticed at Ternium are quite reassuring. The data shows that returns on capital have increased substantially over the last five years to 34%. The company is effectively making more money per dollar of capital used, and it's worth noting that the amount of capital has increased too, by 125%. The increasing returns on a growing amount of capital is common amongst multi-baggers and that's why we're impressed.
In another part of our analysis, we noticed that the company's ratio of current liabilities to total assets decreased to 15%, which broadly means the business is relying less on its suppliers or short-term creditors to fund its operations. Therefore we can rest assured that the growth in ROCE is a result of the business' fundamental improvements, rather than a cooking class featuring this company's books.
The Bottom Line
In summary, it's great to see that Ternium can compound returns by consistently reinvesting capital at increasing rates of return, because these are some of the key ingredients of those highly sought after multi-baggers. Since the stock has only returned 8.7% to shareholders over the last five years, the promising fundamentals may not be recognized yet by investors. So exploring more about this stock could uncover a good opportunity, if the valuation and other metrics stack up.
One final note, you should learn about the 2 warning signs we've spotted with Ternium (including 1 which can't be ignored) .
If you'd like to see other companies earning high returns, check out our free list of companies earning high returns with solid balance sheets here.
Have feedback on this article? Concerned about the content? Get in touch with us directly. Alternatively, email editorial-team (at) simplywallst.com.
This article by Simply Wall St is general in nature. We provide commentary based on historical data and analyst forecasts only using an unbiased methodology and our articles are not intended to be financial advice. It does not constitute a recommendation to buy or sell any stock, and does not take account of your objectives, or your financial situation. We aim to bring you long-term focused analysis driven by fundamental data. Note that our analysis may not factor in the latest price-sensitive company announcements or qualitative material. Simply Wall St has no position in any stocks mentioned.
Join A Paid User Research Session
You’ll receive a US$30 Amazon Gift card for 1 hour of your time while helping us build better investing tools for the individual investors like yourself. Sign up here
