
 Yahoo Finance
 Returns On Capital Signal Tricky Times Ahead For Cambium Networks (NASDAQ:CMBM)
If you're not sure where to start when looking for the next multi-bagger, there are a few key trends you should keep an eye out for. Typically, we'll want to notice a trend of growing return on capital employed (ROCE) and alongside that, an expanding base of capital employed. Basically this means that a company has profitable initiatives that it can continue to reinvest in, which is a trait of a compounding machine. Although, when we looked at Cambium Networks (NASDAQ:CMBM), it didn't seem to tick all of these boxes.
Understanding Return On Capital Employed (ROCE)
For those that aren't sure what ROCE is, it measures the amount of pre-tax profits a company can generate from the capital employed in its business. Analysts use this formula to calculate it for Cambium Networks:
Return on Capital Employed = Earnings Before Interest and Tax (EBIT) ÷ (Total Assets - Current Liabilities)
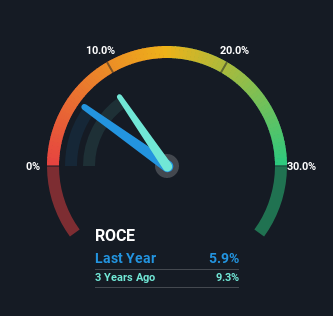
0.059 = US$9.2m ÷ (US$235m - US$80m) (Based on the trailing twelve months to June 2022).
Therefore, Cambium Networks has an ROCE of 5.9%. In absolute terms, that's a low return and it also under-performs the Communications industry average of 8.5%.
Check out our latest analysis for Cambium Networks
Above you can see how the current ROCE for Cambium Networks compares to its prior returns on capital, but there's only so much you can tell from the past. If you'd like to see what analysts are forecasting going forward, you should check out our free report for Cambium Networks.
What Does the ROCE Trend For Cambium Networks Tell Us?
In terms of Cambium Networks' historical ROCE movements, the trend isn't fantastic. Over the last five years, returns on capital have decreased to 5.9% from 19% five years ago. Given the business is employing more capital while revenue has slipped, this is a bit concerning. If this were to continue, you might be looking at a company that is trying to reinvest for growth but is actually losing market share since sales haven't increased.
What We Can Learn From Cambium Networks' ROCE
In summary, we're somewhat concerned by Cambium Networks' diminishing returns on increasing amounts of capital. Yet despite these concerning fundamentals, the stock has performed strongly with a 93% return over the last three years, so investors appear very optimistic. In any case, the current underlying trends don't bode well for long term performance so unless they reverse, we'd start looking elsewhere.
On a final note, we've found 1 warning sign for Cambium Networks that we think you should be aware of.
If you want to search for solid companies with great earnings, check out this free list of companies with good balance sheets and impressive returns on equity.
Have feedback on this article? Concerned about the content? Get in touch with us directly. Alternatively, email editorial-team (at) simplywallst.com.
This article by Simply Wall St is general in nature. We provide commentary based on historical data and analyst forecasts only using an unbiased methodology and our articles are not intended to be financial advice. It does not constitute a recommendation to buy or sell any stock, and does not take account of your objectives, or your financial situation. We aim to bring you long-term focused analysis driven by fundamental data. Note that our analysis may not factor in the latest price-sensitive company announcements or qualitative material. Simply Wall St has no position in any stocks mentioned.
Join A Paid User Research Session
You’ll receive a US$30 Amazon Gift card for 1 hour of your time while helping us build better investing tools for the individual investors like yourself. Sign up here
