
 Yahoo Finance
 What Do The Returns On Capital At Roots (TSE:ROOT) Tell Us?

There are a few key trends to look for if we want to identify the next multi-bagger. Ideally, a business will show two trends; firstly a growing return on capital employed (ROCE) and secondly, an increasing amount of capital employed. Basically this means that a company has profitable initiatives that it can continue to reinvest in, which is a trait of a compounding machine. Having said that, from a first glance at Roots (TSE:ROOT) we aren't jumping out of our chairs at how returns are trending, but let's have a deeper look.
Understanding Return On Capital Employed (ROCE)
Just to clarify if you're unsure, ROCE is a metric for evaluating how much pre-tax income (in percentage terms) a company earns on the capital invested in its business. Analysts use this formula to calculate it for Roots:
Return on Capital Employed = Earnings Before Interest and Tax (EBIT) ÷ (Total Assets - Current Liabilities)
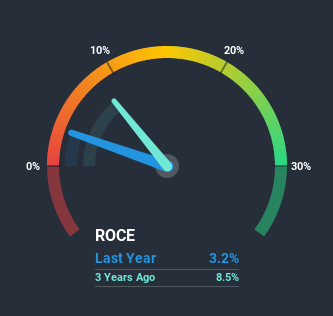
0.032 = CA$11m ÷ (CA$410m - CA$60m) (Based on the trailing twelve months to May 2020).
Thus, Roots has an ROCE of 3.2%. Ultimately, that's a low return and it under-performs the Specialty Retail industry average of 9.4%.
View our latest analysis for Roots
In the above chart we have measured Roots' prior ROCE against its prior performance, but the future is arguably more important. If you'd like to see what analysts are forecasting going forward, you should check out our free report for Roots.
What The Trend Of ROCE Can Tell Us
Things have been pretty stable at Roots, with its capital employed and returns on that capital staying somewhat the same for the last four years. This tells us the company isn't reinvesting in itself, so it's plausible that it's past the growth phase. With that in mind, unless investment picks up again in the future, we wouldn't expect Roots to be a multi-bagger going forward.
The Bottom Line
In summary, Roots isn't compounding its earnings but is generating stable returns on the same amount of capital employed. And investors appear hesitant that the trends will pick up because the stock has fallen 55% in the last year. On the whole, we aren't too inspired by the underlying trends and we think there may be better chances of finding a multi-bagger elsewhere.
Roots does have some risks, we noticed 3 warning signs (and 2 which are concerning) we think you should know about.
If you want to search for solid companies with great earnings, check out this free list of companies with good balance sheets and impressive returns on equity.
This article by Simply Wall St is general in nature. It does not constitute a recommendation to buy or sell any stock, and does not take account of your objectives, or your financial situation. We aim to bring you long-term focused analysis driven by fundamental data. Note that our analysis may not factor in the latest price-sensitive company announcements or qualitative material. Simply Wall St has no position in any stocks mentioned.
Have feedback on this article? Concerned about the content? Get in touch with us directly. Alternatively, email editorial-team@simplywallst.com.
