
 Yahoo Finance
 Our Take On The Returns On Capital At Interface (NASDAQ:TILE)
If you're looking for a multi-bagger, there's a few things to keep an eye out for. One common approach is to try and find a company with returns on capital employed (ROCE) that are increasing, in conjunction with a growing amount of capital employed. If you see this, it typically means it's a company with a great business model and plenty of profitable reinvestment opportunities. However, after investigating Interface (NASDAQ:TILE), we don't think it's current trends fit the mold of a multi-bagger.
Return On Capital Employed (ROCE): What is it?
If you haven't worked with ROCE before, it measures the 'return' (pre-tax profit) a company generates from capital employed in its business. Analysts use this formula to calculate it for Interface:
Return on Capital Employed = Earnings Before Interest and Tax (EBIT) ÷ (Total Assets - Current Liabilities)
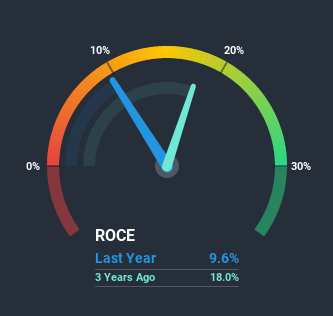
0.096 = US$102m ÷ (US$1.3b - US$245m) (Based on the trailing twelve months to October 2020).
Therefore, Interface has an ROCE of 9.6%. In absolute terms, that's a low return but it's around the Commercial Services industry average of 9.4%.
See our latest analysis for Interface
In the above chart we have measured Interface's prior ROCE against its prior performance, but the future is arguably more important. If you'd like, you can check out the forecasts from the analysts covering Interface here for free.
What Does the ROCE Trend For Interface Tell Us?
When we looked at the ROCE trend at Interface, we didn't gain much confidence. Over the last five years, returns on capital have decreased to 9.6% from 19% five years ago. Given the business is employing more capital while revenue has slipped, this is a bit concerning. If this were to continue, you might be looking at a company that is trying to reinvest for growth but is actually losing market share since sales haven't increased.
In Conclusion...
In summary, we're somewhat concerned by Interface's diminishing returns on increasing amounts of capital. It should come as no surprise then that the stock has fallen 26% over the last five years, so it looks like investors are recognizing these changes. That being the case, unless the underlying trends revert to a more positive trajectory, we'd consider looking elsewhere.
One more thing: We've identified 2 warning signs with Interface (at least 1 which can't be ignored) , and understanding them would certainly be useful.
If you want to search for solid companies with great earnings, check out this free list of companies with good balance sheets and impressive returns on equity.
This article by Simply Wall St is general in nature. It does not constitute a recommendation to buy or sell any stock, and does not take account of your objectives, or your financial situation. We aim to bring you long-term focused analysis driven by fundamental data. Note that our analysis may not factor in the latest price-sensitive company announcements or qualitative material. Simply Wall St has no position in any stocks mentioned.
Have feedback on this article? Concerned about the content? Get in touch with us directly. Alternatively, email editorial-team (at) simplywallst.com.
