
 Yahoo Finance
 Returns On Capital At Chartwell Retirement Residences (TSE:CSH.UN) Paint A Concerning Picture
Finding a business that has the potential to grow substantially is not easy, but it is possible if we look at a few key financial metrics. Firstly, we'd want to identify a growing return on capital employed (ROCE) and then alongside that, an ever-increasing base of capital employed. Basically this means that a company has profitable initiatives that it can continue to reinvest in, which is a trait of a compounding machine. Having said that, from a first glance at Chartwell Retirement Residences (TSE:CSH.UN) we aren't jumping out of our chairs at how returns are trending, but let's have a deeper look.
Understanding Return On Capital Employed (ROCE)
For those that aren't sure what ROCE is, it measures the amount of pre-tax profits a company can generate from the capital employed in its business. The formula for this calculation on Chartwell Retirement Residences is:
Return on Capital Employed = Earnings Before Interest and Tax (EBIT) ÷ (Total Assets - Current Liabilities)
0.022 = CA$69m ÷ (CA$3.5b - CA$417m) (Based on the trailing twelve months to March 2021).
Therefore, Chartwell Retirement Residences has an ROCE of 2.2%. In absolute terms, that's a low return and it also under-performs the Healthcare industry average of 18%.
View our latest analysis for Chartwell Retirement Residences
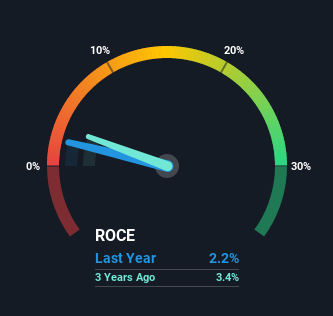
Above you can see how the current ROCE for Chartwell Retirement Residences compares to its prior returns on capital, but there's only so much you can tell from the past. If you'd like to see what analysts are forecasting going forward, you should check out our free report for Chartwell Retirement Residences.
The Trend Of ROCE
In terms of Chartwell Retirement Residences' historical ROCE movements, the trend isn't fantastic. Over the last five years, returns on capital have decreased to 2.2% from 3.4% five years ago. Meanwhile, the business is utilizing more capital but this hasn't moved the needle much in terms of sales in the past 12 months, so this could reflect longer term investments. It may take some time before the company starts to see any change in earnings from these investments.
Our Take On Chartwell Retirement Residences' ROCE
To conclude, we've found that Chartwell Retirement Residences is reinvesting in the business, but returns have been falling. Unsurprisingly, the stock has only gained 8.2% over the last five years, which potentially indicates that investors are accounting for this going forward. Therefore, if you're looking for a multi-bagger, we'd propose looking at other options.
Chartwell Retirement Residences does come with some risks though, we found 3 warning signs in our investment analysis, and 2 of those are significant...
While Chartwell Retirement Residences may not currently earn the highest returns, we've compiled a list of companies that currently earn more than 25% return on equity. Check out this free list here.
This article by Simply Wall St is general in nature. It does not constitute a recommendation to buy or sell any stock, and does not take account of your objectives, or your financial situation. We aim to bring you long-term focused analysis driven by fundamental data. Note that our analysis may not factor in the latest price-sensitive company announcements or qualitative material. Simply Wall St has no position in any stocks mentioned.
Have feedback on this article? Concerned about the content? Get in touch with us directly. Alternatively, email editorial-team (at) simplywallst.com.
