
 Yahoo Finance
 Returns At Amerigo Resources (TSE:ARG) Are On The Way Up
To find a multi-bagger stock, what are the underlying trends we should look for in a business? Typically, we'll want to notice a trend of growing return on capital employed (ROCE) and alongside that, an expanding base of capital employed. Ultimately, this demonstrates that it's a business that is reinvesting profits at increasing rates of return. So when we looked at Amerigo Resources (TSE:ARG) and its trend of ROCE, we really liked what we saw.
Understanding Return On Capital Employed (ROCE)
For those that aren't sure what ROCE is, it measures the amount of pre-tax profits a company can generate from the capital employed in its business. Analysts use this formula to calculate it for Amerigo Resources:
Return on Capital Employed = Earnings Before Interest and Tax (EBIT) ÷ (Total Assets - Current Liabilities)
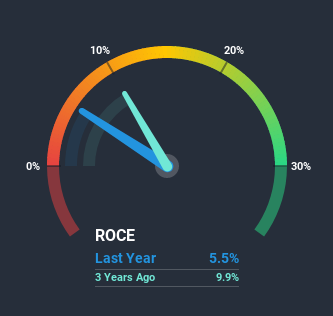
0.055 = US$10m ÷ (US$238m - US$50m) (Based on the trailing twelve months to December 2020).
So, Amerigo Resources has an ROCE of 5.5%. On its own that's a low return, but compared to the average of 1.8% generated by the Metals and Mining industry, it's much better.
View our latest analysis for Amerigo Resources
While the past is not representative of the future, it can be helpful to know how a company has performed historically, which is why we have this chart above. If you want to delve into the historical earnings, revenue and cash flow of Amerigo Resources, check out these free graphs here.
What Can We Tell From Amerigo Resources' ROCE Trend?
Shareholders will be relieved that Amerigo Resources has broken into profitability. The company was generating losses five years ago, but has managed to turn it around and as we saw earlier is now earning 5.5%, which is always encouraging. While returns have increased, the amount of capital employed by Amerigo Resources has remained flat over the period. So while we're happy that the business is more efficient, just keep in mind that could mean that going forward the business is lacking areas to invest internally for growth. After all, a company can only become a long term multi-bagger if it continually reinvests in itself at high rates of return.
The Bottom Line On Amerigo Resources' ROCE
To bring it all together, Amerigo Resources has done well to increase the returns it's generating from its capital employed. And a remarkable 675% total return over the last five years tells us that investors are expecting more good things to come in the future. So given the stock has proven it has promising trends, it's worth researching the company further to see if these trends are likely to persist.
If you'd like to know more about Amerigo Resources, we've spotted 2 warning signs, and 1 of them can't be ignored.
While Amerigo Resources may not currently earn the highest returns, we've compiled a list of companies that currently earn more than 25% return on equity. Check out this free list here.
This article by Simply Wall St is general in nature. It does not constitute a recommendation to buy or sell any stock, and does not take account of your objectives, or your financial situation. We aim to bring you long-term focused analysis driven by fundamental data. Note that our analysis may not factor in the latest price-sensitive company announcements or qualitative material. Simply Wall St has no position in any stocks mentioned.
Have feedback on this article? Concerned about the content? Get in touch with us directly. Alternatively, email editorial-team (at) simplywallst.com.
