
 Yahoo Finance
 The Return Trends At Mene (CVE:MENE) Look Promising
If we want to find a stock that could multiply over the long term, what are the underlying trends we should look for? Firstly, we'd want to identify a growing return on capital employed (ROCE) and then alongside that, an ever-increasing base of capital employed. Ultimately, this demonstrates that it's a business that is reinvesting profits at increasing rates of return. Speaking of which, we noticed some great changes in Mene's (CVE:MENE) returns on capital, so let's have a look.
Understanding Return On Capital Employed (ROCE)
Just to clarify if you're unsure, ROCE is a metric for evaluating how much pre-tax income (in percentage terms) a company earns on the capital invested in its business. The formula for this calculation on Mene is:
Return on Capital Employed = Earnings Before Interest and Tax (EBIT) ÷ (Total Assets - Current Liabilities)
0.018 = CA$319k ÷ (CA$30m - CA$12m) (Based on the trailing twelve months to December 2021).
Thus, Mene has an ROCE of 1.8%. In absolute terms, that's a low return and it also under-performs the Luxury industry average of 15%.
Check out our latest analysis for Mene
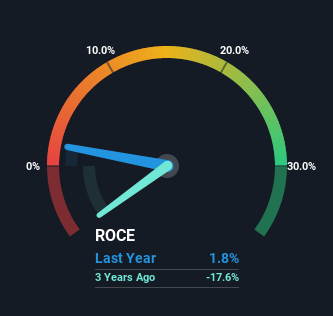
Historical performance is a great place to start when researching a stock so above you can see the gauge for Mene's ROCE against it's prior returns. If you want to delve into the historical earnings, revenue and cash flow of Mene, check out these free graphs here.
What The Trend Of ROCE Can Tell Us
Shareholders will be relieved that Mene has broken into profitability. The company now earns 1.8% on its capital, because four years ago it was incurring losses. On top of that, what's interesting is that the amount of capital being employed has remained steady, so the business hasn't needed to put any additional money to work to generate these higher returns. With no noticeable increase in capital employed, it's worth knowing what the company plans on doing going forward in regards to reinvesting and growing the business. After all, a company can only become a long term multi-bagger if it continually reinvests in itself at high rates of return.
On a side note, we noticed that the improvement in ROCE appears to be partly fueled by an increase in current liabilities. The current liabilities has increased to 41% of total assets, so the business is now more funded by the likes of its suppliers or short-term creditors. And with current liabilities at those levels, that's pretty high.
What We Can Learn From Mene's ROCE
As discussed above, Mene appears to be getting more proficient at generating returns since capital employed has remained flat but earnings (before interest and tax) are up. Since the stock has only returned 17% to shareholders over the last three years, the promising fundamentals may not be recognized yet by investors. So exploring more about this stock could uncover a good opportunity, if the valuation and other metrics stack up.
Mene does have some risks though, and we've spotted 1 warning sign for Mene that you might be interested in.
While Mene isn't earning the highest return, check out this free list of companies that are earning high returns on equity with solid balance sheets.
Have feedback on this article? Concerned about the content? Get in touch with us directly. Alternatively, email editorial-team (at) simplywallst.com.
This article by Simply Wall St is general in nature. We provide commentary based on historical data and analyst forecasts only using an unbiased methodology and our articles are not intended to be financial advice. It does not constitute a recommendation to buy or sell any stock, and does not take account of your objectives, or your financial situation. We aim to bring you long-term focused analysis driven by fundamental data. Note that our analysis may not factor in the latest price-sensitive company announcements or qualitative material. Simply Wall St has no position in any stocks mentioned.
