
 Yahoo Finance
 The Return Trends At Imdex (ASX:IMD) Look Promising
If we want to find a potential multi-bagger, often there are underlying trends that can provide clues. In a perfect world, we'd like to see a company investing more capital into its business and ideally the returns earned from that capital are also increasing. Put simply, these types of businesses are compounding machines, meaning they are continually reinvesting their earnings at ever-higher rates of return. With that in mind, we've noticed some promising trends at Imdex (ASX:IMD) so let's look a bit deeper.
What is Return On Capital Employed (ROCE)?
For those that aren't sure what ROCE is, it measures the amount of pre-tax profits a company can generate from the capital employed in its business. The formula for this calculation on Imdex is:
Return on Capital Employed = Earnings Before Interest and Tax (EBIT) ÷ (Total Assets - Current Liabilities)
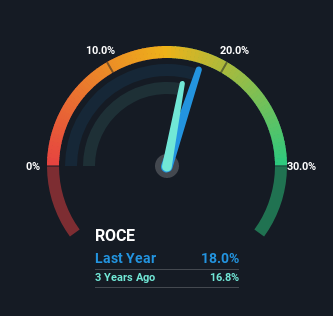
0.18 = AU$60m ÷ (AU$395m - AU$61m) (Based on the trailing twelve months to December 2021).
Therefore, Imdex has an ROCE of 18%. On its own, that's a standard return, however it's much better than the 8.6% generated by the Metals and Mining industry.
See our latest analysis for Imdex
Above you can see how the current ROCE for Imdex compares to its prior returns on capital, but there's only so much you can tell from the past. If you'd like to see what analysts are forecasting going forward, you should check out our free report for Imdex.
What Can We Tell From Imdex's ROCE Trend?
We like the trends that we're seeing from Imdex. The numbers show that in the last five years, the returns generated on capital employed have grown considerably to 18%. The company is effectively making more money per dollar of capital used, and it's worth noting that the amount of capital has increased too, by 110%. So we're very much inspired by what we're seeing at Imdex thanks to its ability to profitably reinvest capital.
The Key Takeaway
A company that is growing its returns on capital and can consistently reinvest in itself is a highly sought after trait, and that's what Imdex has. Since the stock has returned a staggering 215% to shareholders over the last five years, it looks like investors are recognizing these changes. So given the stock has proven it has promising trends, it's worth researching the company further to see if these trends are likely to persist.
Imdex does have some risks though, and we've spotted 2 warning signs for Imdex that you might be interested in.
While Imdex may not currently earn the highest returns, we've compiled a list of companies that currently earn more than 25% return on equity. Check out this free list here.
Have feedback on this article? Concerned about the content? Get in touch with us directly. Alternatively, email editorial-team (at) simplywallst.com.
This article by Simply Wall St is general in nature. We provide commentary based on historical data and analyst forecasts only using an unbiased methodology and our articles are not intended to be financial advice. It does not constitute a recommendation to buy or sell any stock, and does not take account of your objectives, or your financial situation. We aim to bring you long-term focused analysis driven by fundamental data. Note that our analysis may not factor in the latest price-sensitive company announcements or qualitative material. Simply Wall St has no position in any stocks mentioned.
