
 Yahoo Finance
 The Return Trends At Extendicare (TSE:EXE) Look Promising
What are the early trends we should look for to identify a stock that could multiply in value over the long term? Firstly, we'd want to identify a growing return on capital employed (ROCE) and then alongside that, an ever-increasing base of capital employed. Ultimately, this demonstrates that it's a business that is reinvesting profits at increasing rates of return. So on that note, Extendicare (TSE:EXE) looks quite promising in regards to its trends of return on capital.
What is Return On Capital Employed (ROCE)?
For those that aren't sure what ROCE is, it measures the amount of pre-tax profits a company can generate from the capital employed in its business. The formula for this calculation on Extendicare is:
Return on Capital Employed = Earnings Before Interest and Tax (EBIT) ÷ (Total Assets - Current Liabilities)
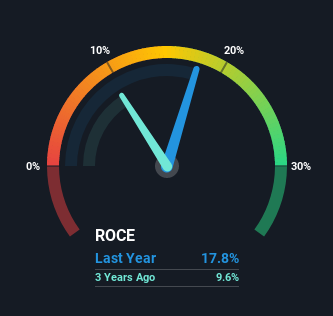
0.18 = CA$108m ÷ (CA$909m - CA$305m) (Based on the trailing twelve months to September 2021).
So, Extendicare has an ROCE of 18%. In absolute terms, that's a satisfactory return, but compared to the Healthcare industry average of 13% it's much better.
View our latest analysis for Extendicare
Above you can see how the current ROCE for Extendicare compares to its prior returns on capital, but there's only so much you can tell from the past. If you're interested, you can view the analysts predictions in our free report on analyst forecasts for the company.
What Does the ROCE Trend For Extendicare Tell Us?
You'd find it hard not to be impressed with the ROCE trend at Extendicare. We found that the returns on capital employed over the last five years have risen by 125%. That's a very favorable trend because this means that the company is earning more per dollar of capital that's being employed. Speaking of capital employed, the company is actually utilizing 23% less than it was five years ago, which can be indicative of a business that's improving its efficiency. A business that's shrinking its asset base like this isn't usually typical of a soon to be multi-bagger company.
For the record though, there was a noticeable increase in the company's current liabilities over the period, so we would attribute some of the ROCE growth to that. Essentially the business now has suppliers or short-term creditors funding about 34% of its operations, which isn't ideal. It's worth keeping an eye on this because as the percentage of current liabilities to total assets increases, some aspects of risk also increase.
Our Take On Extendicare's ROCE
In summary, it's great to see that Extendicare has been able to turn things around and earn higher returns on lower amounts of capital. Since the total return from the stock has been almost flat over the last five years, there might be an opportunity here if the valuation looks good. With that in mind, we believe the promising trends warrant this stock for further investigation.
On a final note, we found 3 warning signs for Extendicare (2 make us uncomfortable) you should be aware of.
For those who like to invest in solid companies, check out this free list of companies with solid balance sheets and high returns on equity.
This article by Simply Wall St is general in nature. We provide commentary based on historical data and analyst forecasts only using an unbiased methodology and our articles are not intended to be financial advice. It does not constitute a recommendation to buy or sell any stock, and does not take account of your objectives, or your financial situation. We aim to bring you long-term focused analysis driven by fundamental data. Note that our analysis may not factor in the latest price-sensitive company announcements or qualitative material. Simply Wall St has no position in any stocks mentioned.
Have feedback on this article? Concerned about the content? Get in touch with us directly. Alternatively, email editorial-team (at) simplywallst.com.
