
 Yahoo Finance
 Is Return Energy Inc. (CVE:RTN) Excessively Paying Its CEO?

In 2016 Ken Tompson was appointed CEO of Return Energy Inc. (CVE:RTN). This analysis aims first to contrast CEO compensation with other companies that have similar market capitalization. Next, we'll consider growth that the business demonstrates. And finally we will reflect on how common stockholders have fared in the last few years, as a secondary measure of performance. This method should give us information to assess how appropriately the company pays the CEO.
See our latest analysis for Return Energy
How Does Ken Tompson's Compensation Compare With Similar Sized Companies?
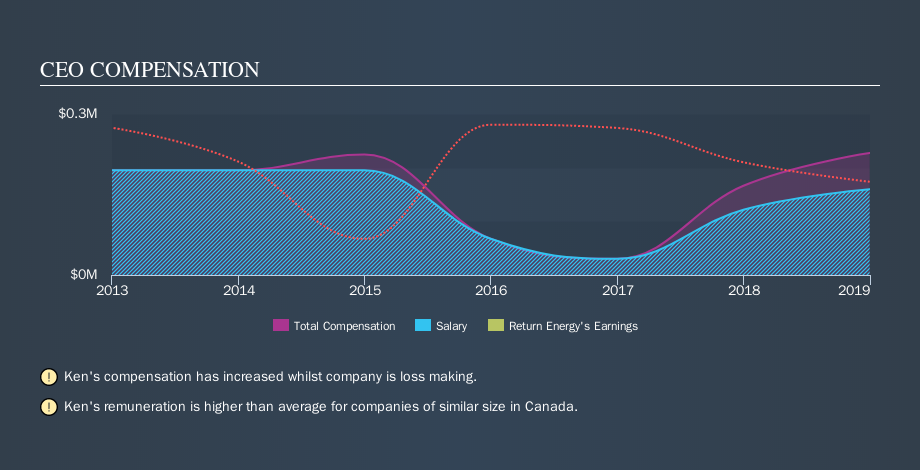
At the time of writing, our data says that Return Energy Inc. has a market cap of CA$1.1m, and reported total annual CEO compensation of CA$227k for the year to December 2018. While we always look at total compensation first, we note that the salary component is less, at CA$160k. We took a group of companies with market capitalizations below CA$266m, and calculated the median CEO total compensation to be CA$158k.
It would therefore appear that Return Energy Inc. pays Ken Tompson more than the median CEO remuneration at companies of a similar size, in the same market. However, this fact alone doesn't mean the remuneration is too high. A closer look at the performance of the underlying business will give us a better idea about whether the pay is particularly generous.
The graphic below shows how CEO compensation at Return Energy has changed from year to year.
Is Return Energy Inc. Growing?
Over the last three years Return Energy Inc. has grown its earnings per share (EPS) by an average of 8.8% per year (using a line of best fit). In the last year, its revenue is down 11%.
I would argue that the lack of revenue growth in the last year is less than ideal, but I'm happy with the EPS growth. These two metric are moving in different directions, so while it's hard to be confident judging performance, we think the stock is worth watching. We don't have analyst forecasts, but shareholders might want to examine this detailed historical graph of earnings, revenue and cash flow.
Has Return Energy Inc. Been A Good Investment?
With a three year total loss of 80%, Return Energy Inc. would certainly have some dissatisfied shareholders. This suggests it would be unwise for the company to pay the CEO too generously.
In Summary...
We compared the total CEO remuneration paid by Return Energy Inc., and compared it to remuneration at a group of similar sized companies. As discussed above, we discovered that the company pays more than the median of that group.
The growth in the business has been uninspiring, but the shareholder returns have arguably been worse, over the last three years. Shareholders may wish to consider further research. Although we don't think the CEO pay is too high, it is probably more on the generous side of things. If you think CEO compensation levels are interesting you will probably really like this free visualization of insider trading at Return Energy.
Of course, you might find a fantastic investment by looking elsewhere. So take a peek at this free list of interesting companies.
We aim to bring you long-term focused research analysis driven by fundamental data. Note that our analysis may not factor in the latest price-sensitive company announcements or qualitative material.
If you spot an error that warrants correction, please contact the editor at editorial-team@simplywallst.com. This article by Simply Wall St is general in nature. It does not constitute a recommendation to buy or sell any stock, and does not take account of your objectives, or your financial situation. Simply Wall St has no position in the stocks mentioned. Thank you for reading.
