
 Yahoo Finance
 Reliance Steel & Aluminum (NYSE:RS) Could Become A Multi-Bagger
If you're not sure where to start when looking for the next multi-bagger, there are a few key trends you should keep an eye out for. Ideally, a business will show two trends; firstly a growing return on capital employed (ROCE) and secondly, an increasing amount of capital employed. Basically this means that a company has profitable initiatives that it can continue to reinvest in, which is a trait of a compounding machine. Speaking of which, we noticed some great changes in Reliance Steel & Aluminum's (NYSE:RS) returns on capital, so let's have a look.
What Is Return On Capital Employed (ROCE)?
Just to clarify if you're unsure, ROCE is a metric for evaluating how much pre-tax income (in percentage terms) a company earns on the capital invested in its business. Analysts use this formula to calculate it for Reliance Steel & Aluminum:
Return on Capital Employed = Earnings Before Interest and Tax (EBIT) ÷ (Total Assets - Current Liabilities)
0.25 = US$2.3b ÷ (US$10b - US$975m) (Based on the trailing twelve months to March 2023).
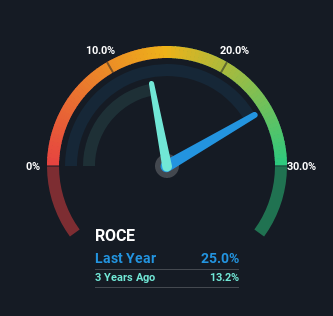
Thus, Reliance Steel & Aluminum has an ROCE of 25%. In absolute terms that's a great return and it's even better than the Metals and Mining industry average of 13%.
See our latest analysis for Reliance Steel & Aluminum
In the above chart we have measured Reliance Steel & Aluminum's prior ROCE against its prior performance, but the future is arguably more important. If you're interested, you can view the analysts predictions in our free report on analyst forecasts for the company.
What The Trend Of ROCE Can Tell Us
The trends we've noticed at Reliance Steel & Aluminum are quite reassuring. Over the last five years, returns on capital employed have risen substantially to 25%. The company is effectively making more money per dollar of capital used, and it's worth noting that the amount of capital has increased too, by 27%. This can indicate that there's plenty of opportunities to invest capital internally and at ever higher rates, a combination that's common among multi-baggers.
The Key Takeaway
In summary, it's great to see that Reliance Steel & Aluminum can compound returns by consistently reinvesting capital at increasing rates of return, because these are some of the key ingredients of those highly sought after multi-baggers. And a remarkable 184% total return over the last five years tells us that investors are expecting more good things to come in the future. Therefore, we think it would be worth your time to check if these trends are going to continue.
If you want to know some of the risks facing Reliance Steel & Aluminum we've found 2 warning signs (1 is a bit unpleasant!) that you should be aware of before investing here.
High returns are a key ingredient to strong performance, so check out our free list ofstocks earning high returns on equity with solid balance sheets.
Have feedback on this article? Concerned about the content? Get in touch with us directly. Alternatively, email editorial-team (at) simplywallst.com.
This article by Simply Wall St is general in nature. We provide commentary based on historical data and analyst forecasts only using an unbiased methodology and our articles are not intended to be financial advice. It does not constitute a recommendation to buy or sell any stock, and does not take account of your objectives, or your financial situation. We aim to bring you long-term focused analysis driven by fundamental data. Note that our analysis may not factor in the latest price-sensitive company announcements or qualitative material. Simply Wall St has no position in any stocks mentioned.
Join A Paid User Research Session
You’ll receive a US$30 Amazon Gift card for 1 hour of your time while helping us build better investing tools for the individual investors like yourself. Sign up here
