
 Yahoo Finance
 Regency Centers (REG) Q4 FFO Increases, Revenues Surpass
Regency Centers Corporation’s REG fourth-quarter 2022 core operating earnings per share (EPS) were 98 cents, up 6.5% year over year. The company reported NAREIT funds from operations (FFO) per share of $1.05, which increased from the $1.01 reported in the prior-year quarter. The Zacks Consensus Estimate was pegged at 98 cents.
Total revenues of $314.5 million were 5.9% higher than the year-ago period’s $296.9 million. The figure also outpaced the Zacks Consensus Estimate of $305.2 million. Regency’s results reflect healthy leasing activity and a year-over-year improvement in the base rent.
For the full-year 2023, Regency Centers’ core operating EPS came in at $3.83, up from the year-ago tally of $3.68. The company reported a NAREIT FFO per share of $4.10, which increased from the $4.02 reported in the prior year. The Zacks Consensus Estimate was pegged at $4.03. Total revenues of $1.2 billion were up 5.0% from a year ago.
Behind the Headlines
In the fourth quarter, Regency Centers executed 1.7 million square feet of comparable new and renewal leases at a blended cash rent spread of 7.2%.
As of Dec 31, 2022, REG’s wholly owned portfolio and its pro-rata share of co-investment partnerships were 94.8% leased. Its same-property portfolio was 95.1% leased, reflecting an expansion of 40 basis points (bps) sequentially and 80 bps year over year.
The same-property anchor percent leased (includes spaces greater than or equal to 10,000 square feet) was 96.9%, marking a rise of 20 bps sequentially. The same-property shop percent leased (includes spaces less than 10,000 square feet) was 92.0%, rising 60 bps from the prior quarter.
The same-property net operating income (NOI), excluding lease termination fees, increased 4.3% on a year-over-year basis to $220.1 million. An increase in same-property base rents contributed 4.8% to same-property NOI growth in the quarter.
In the fourth quarter, REG completed acquisitions for a combined total of $39 million. This included East Meadow Plaza for $30 million and its partner’s 50% stake in Kroger New Albany Center for $9 million. Also, the company accomplished the disposition of one property for a total of $1.4 million at Regency’s share.
As of Dec 31, 2022, Regency Centers’ in-process development and redevelopment projects estimated net project costs of around $301 million at the company’s share. So far, it has incurred 51% of the cost.
Balance Sheet
Regency Centers ended 2022 with cash, cash equivalents and restricted cash of $68.8 million, down from $95.0 million as of Dec 31, 2021.
As of Dec 31, 2022, this retail REIT had full capacity available under its $1.2-billion revolving credit facility. As of the same date, its pro-rata net debt-to-operating EBITDAre was 5.0X.
Dividend Update
On Feb 8, Regency Centers’ board of directors declared a quarterly cash dividend payment on its common stock of 65 cents. The dividend will be paid out on Apr 5, 2023 to its shareholders on record as of Mar 15, 2023.
2023 Outlook
Regency Centers provided the initial 2023 guidance. REG projects core operating EPS between $3.83 and $3.89.
The current-year NAREIT FFO per share is expected in the range of $4.03-$4.11. The Zacks Consensus Estimate is presently pegged at $4.04. The same-property NOI (excluding termination fees) is expected between 0% and 1.0%.
Regency Centers currently carries a Zacks Rank #3 (Hold). You can see the complete list of today’s Zacks #1 Rank (Strong Buy) stocks here.
Regency Centers Corporation Price, Consensus and EPS Surprise
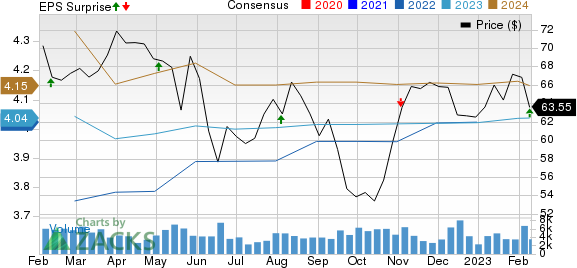
Regency Centers Corporation price-consensus-eps-surprise-chart | Regency Centers Corporation Quote
Performance of Other Retail REITs
Simon Property Group, Inc.’s SPG fourth-quarter 2022 comparable FFO per share of $3.15 beat the Zacks Consensus Estimate of $3.14. The figure compared favorably with the year-ago quarter’s $3.11. Simon Property’s performance was backed by a better-than-expected top line. Results reflected a healthy operating performance and growth in occupancy levels.
Federal Realty Investment Trust’s FRT fourth-quarter 2022 FFO per share of $1.58 topped the Zacks Consensus Estimate of $1.57. This also compared favorably with the year-ago quarter’s tally of $1.47. Federal Realty’s results reflected healthy leasing activity and better-than-anticipated revenues. This retail REIT provided an upbeat outlook for 2023, with the FFO per share projection exceeding the consensus mark.
Kimco Realty Corp.’s KIM fourth-quarter 2022 FFO per share came in at 38 cents, missing the Zacks Consensus Estimate of 39 cents. The figure also compared unfavorably with the year-ago quarter’s 39 cents. Though Kimco reported growth in revenues, a rise in interest expenses acted as a dampener.
Note: Anything related to earnings presented in this write-up represent funds from operations (FFO) — a widely used metric to gauge the performance of REITs.
Want the latest recommendations from Zacks Investment Research? Today, you can download 7 Best Stocks for the Next 30 Days. Click to get this free report
Simon Property Group, Inc. (SPG) : Free Stock Analysis Report
Kimco Realty Corporation (KIM) : Free Stock Analysis Report
Federal Realty Investment Trust (FRT) : Free Stock Analysis Report
Regency Centers Corporation (REG) : Free Stock Analysis Report
