Regency Centers (REG) Q4 FFO Beats Estimates, Revenues Up
Regency Centers Corporation’s REG fourth-quarter 2019 NAREIT funds from operations (FFO) per share of $1.00 surpassed the Zacks Consensus Estimate of 98 cents. The reported figure was 2% higher than the prior-year quarter number.
Quarterly results reflected growth in revenues, driven by an increase in lease income and other property income. Also, decent leasing activity and rent spreads aided performance.
Total revenues in the quarter were $280.9 million, lagging the Zacks Consensus Estimate of $284.7 million. However, the figure increased from the year-ago figure of $277.1 million.
For 2019, NAREIT FFO per share was $3.89, which surpassed the Zacks Consensus Estimate of $3.87. The reported figure was 1.6% higher than the prior-year number. Total revenues were $1.10 billion, missing the Zacks Consensus Estimate of $1.13 billion. However, the figure increased from the year-ago number of $1.09 billion.
Inside the Headlines
During the reported quarter, Regency Centers executed 1.8 million square feet of comparable new and renewal leases, leading to rent spread on new leases and renewal leases of 19.6% and 8.8%, respectively, with blended rent spreads for the December-end quarter of 11.3%.
As of Dec 31, 2019, the company’s wholly-owned portfolio along with its pro-rata shares of co-investment partnerships was 94.8% leased. Its same-property portfolio was 95.1% leased. Same-property net operating income, excluding termination fees, increased 1.9% on a year-over-year basis.
Regency Centers’ cash and cash equivalents were $115.6 million at Dec 31, 2019, up from $45.2 million recorded at the end of 2018. It has fixed charge coverage of 4.3x.
Portfolio Activity
During the reported quarter, the company sold 3 shopping centers for a total of $58.8 million. Also, it started on phase I of a three-phase redevelopment at Serramonte Center, located south of San Francisco, which included relocating Crunch Fitness to a new outparcel building, the addition of a new Regal theater, and adding several new outparcel restaurants and a new hotel. Notably, phase II commenced in January 2020 and phase III is expected to commence in 2021.
At the end of 2019, the company had 22 properties in development or redevelopment, indicating estimated net project costs of $350.8 million. Further, in-process development and redevelopment projects were 90% leased, projected to yield an average return of 7.3%.
Outlook
Regency Centers expects 2020 NAREIT FFO per share of $3.90-$3.93. The Zacks Consensus Estimate for the same is currently pinned at $3.92.
The company’s full-year outlook is backed by same-property NOI growth, excluding termination fees of 0% or more.
Dividend Update
On Feb 4, 2020, Regency Centers’ board of directors announced a quarterly cash dividend of 59.5 cents per share on its common stock, representing a hike of 1.7%. The dividend will be paid out on Mar 5 to shareholders of record as of Feb 24.
Our Take
While Regency Centers put up a decent show in the fourth quarter, it is not immune to store closures and retail bankruptcies. Moreover, significant upfront costs involved with development and redevelopment pipelines might strain near-term margins.
Nevertheless, the company’s premium quality portfolio of shopping centers, located in strong trade areas, which are characterized by higher spending power, enables it to attract top retailers. Also, investments in value-accretive developments and buyouts will likely enhance its portfolio quality over the long term.
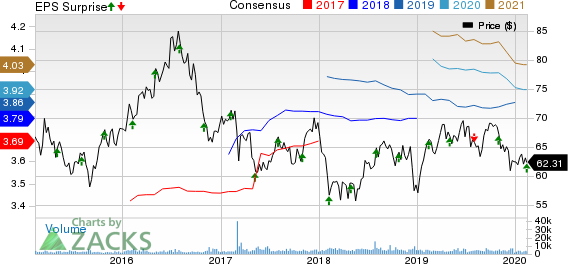
Regency Centers Corporation Price, Consensus and EPS Surprise

Regency Centers Corporation price-consensus-eps-surprise-chart | Regency Centers Corporation Quote
Regency Centers currently carries a Zacks Rank #4 (Sell).
You can see the complete list of today’s Zacks #1 Rank (Strong Buy) stocks here.
Performance & Earnings Release Schedule of Other REITs
Highwoods Properties Inc.’s HIW fourth-quarter 2019 FFO per share of 91 cents surpassed the Zacks Consensus Estimate of 90 cents. The figure also improved from 86 cents reported in the year-ago period.
Boston Properties Inc.’s BXP fourth-quarter 2019 FFO per share of $1.87 surpassed the Zacks Consensus Estimate of $1.85. The reported figure also increased 17.6% from $1.59 reported in the year-ago quarter.
Ventas, Inc. VTR will report results in a few days.
Note: Anything related to earnings presented in this write-up represent funds from operations (FFO) — a widely used metric to gauge the performance of REITs.
5 Stocks Set to Double
Each was hand-picked by a Zacks expert as the #1 favorite stock to gain +100% or more in 2020. Each comes from a different sector and has unique qualities and catalysts that could fuel exceptional growth.
Most of the stocks in this report are flying under Wall Street radar, which provides a great opportunity to get in on the ground floor.
Today, See These 5 Potential Home Runs >>
Want the latest recommendations from Zacks Investment Research? Today, you can download 7 Best Stocks for the Next 30 Days. Click to get this free report
Highwoods Properties, Inc. (HIW) : Free Stock Analysis Report
Boston Properties, Inc. (BXP) : Free Stock Analysis Report
Regency Centers Corporation (REG) : Free Stock Analysis Report
Ventas, Inc. (VTR) : Free Stock Analysis Report
To read this article on Zacks.com click here.
Zacks Investment Research

 Yahoo Finance