
 Yahoo Finance
 Reflecting on Overseas Shipholding Group's (NYSE:OSG) Share Price Returns Over The Last Five Years
Overseas Shipholding Group, Inc. (NYSE:OSG) shareholders should be happy to see the share price up 12% in the last month. But that can't change the reality that over the longer term (five years), the returns have been really quite dismal. Indeed, the share price is down 89% in the period. So we're hesitant to put much weight behind the short term increase. However, in the best case scenario (far from fait accompli), this improved performance might be sustained.
While a drop like that is definitely a body blow, money isn't as important as health and happiness.
Check out our latest analysis for Overseas Shipholding Group
To paraphrase Benjamin Graham: Over the short term the market is a voting machine, but over the long term it's a weighing machine. One flawed but reasonable way to assess how sentiment around a company has changed is to compare the earnings per share (EPS) with the share price.
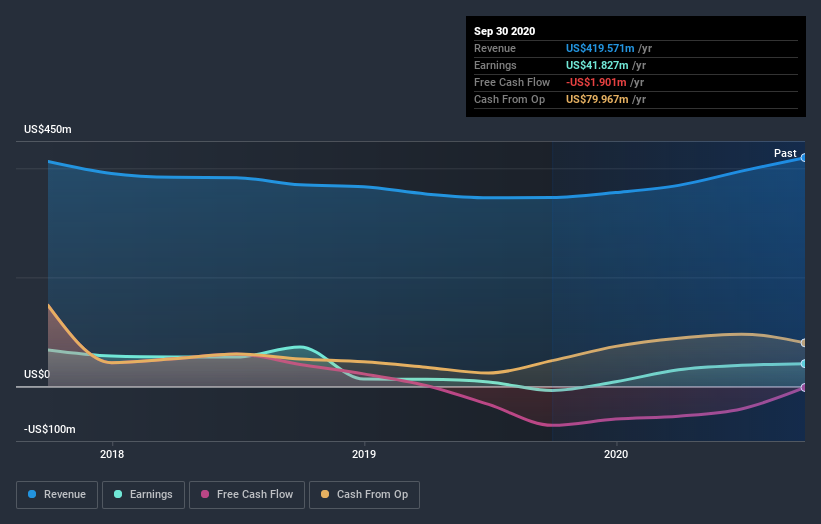
Overseas Shipholding Group became profitable within the last five years. Most would consider that to be a good thing, so it's counter-intuitive to see the share price declining. Other metrics may better explain the share price move.
Arguably, the revenue drop of 5.9% a year for half a decade suggests that the company can't grow in the long term. This has probably encouraged some shareholders to sell down the stock.
You can see below how earnings and revenue have changed over time (discover the exact values by clicking on the image).
We like that insiders have been buying shares in the last twelve months. Even so, future earnings will be far more important to whether current shareholders make money. It might be well worthwhile taking a look at our free report on Overseas Shipholding Group's earnings, revenue and cash flow.
What about the Total Shareholder Return (TSR)?
We'd be remiss not to mention the difference between Overseas Shipholding Group's total shareholder return (TSR) and its share price return. The TSR is a return calculation that accounts for the value of cash dividends (assuming that any dividend received was reinvested) and the calculated value of any discounted capital raisings and spin-offs. Dividends have been really beneficial for Overseas Shipholding Group shareholders, and that cash payout explains why its total shareholder loss of 70%, over the last 5 years, isn't as bad as the share price return.
A Different Perspective
Overseas Shipholding Group provided a TSR of 16% over the last twelve months. Unfortunately this falls short of the market return. On the bright side, that's still a gain, and it is certainly better than the yearly loss of about 11% endured over half a decade. It could well be that the business is stabilizing. I find it very interesting to look at share price over the long term as a proxy for business performance. But to truly gain insight, we need to consider other information, too. Case in point: We've spotted 2 warning signs for Overseas Shipholding Group you should be aware of, and 1 of them makes us a bit uncomfortable.
If you like to buy stocks alongside management, then you might just love this free list of companies. (Hint: insiders have been buying them).
Please note, the market returns quoted in this article reflect the market weighted average returns of stocks that currently trade on US exchanges.
This article by Simply Wall St is general in nature. It does not constitute a recommendation to buy or sell any stock, and does not take account of your objectives, or your financial situation. We aim to bring you long-term focused analysis driven by fundamental data. Note that our analysis may not factor in the latest price-sensitive company announcements or qualitative material. Simply Wall St has no position in any stocks mentioned.
Have feedback on this article? Concerned about the content? Get in touch with us directly. Alternatively, email editorial-team@simplywallst.com.
