
 Yahoo Finance
 Reflecting on National Fuel Gas' (NYSE:NFG) Share Price Returns Over The Last Three Years

For many investors, the main point of stock picking is to generate higher returns than the overall market. But in any portfolio, there are likely to be some stocks that fall short of that benchmark. Unfortunately, that's been the case for longer term National Fuel Gas Company (NYSE:NFG) shareholders, since the share price is down 27% in the last three years, falling well short of the market return of around 43%.
Check out our latest analysis for National Fuel Gas
While markets are a powerful pricing mechanism, share prices reflect investor sentiment, not just underlying business performance. By comparing earnings per share (EPS) and share price changes over time, we can get a feel for how investor attitudes to a company have morphed over time.
National Fuel Gas saw its EPS decline at a compound rate of 37% per year, over the last three years. This fall in the EPS is worse than the 10% compound annual share price fall. So, despite the prior disappointment, shareholders must have some confidence the situation will improve, longer term. This positive sentiment is also reflected in the generous P/E ratio of 53.22.
The image below shows how EPS has tracked over time (if you click on the image you can see greater detail).
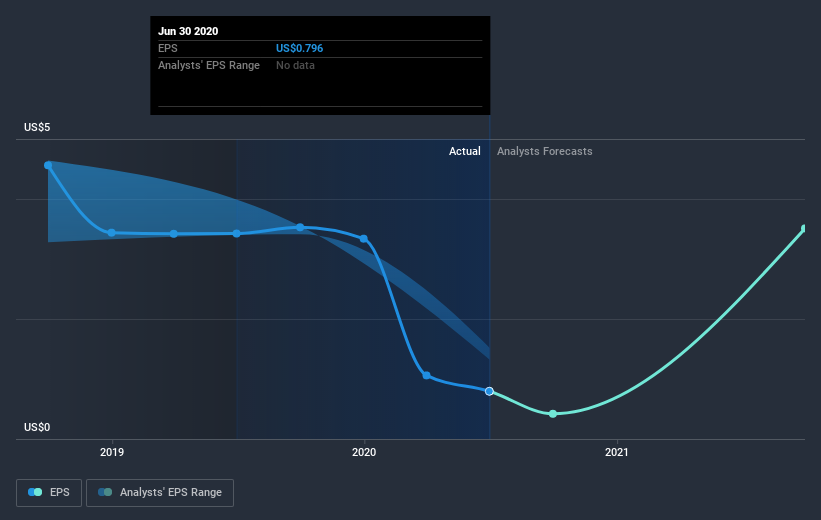
This free interactive report on National Fuel Gas' earnings, revenue and cash flow is a great place to start, if you want to investigate the stock further.
What About Dividends?
It is important to consider the total shareholder return, as well as the share price return, for any given stock. Whereas the share price return only reflects the change in the share price, the TSR includes the value of dividends (assuming they were reinvested) and the benefit of any discounted capital raising or spin-off. It's fair to say that the TSR gives a more complete picture for stocks that pay a dividend. As it happens, National Fuel Gas' TSR for the last 3 years was -18%, which exceeds the share price return mentioned earlier. And there's no prize for guessing that the dividend payments largely explain the divergence!
A Different Perspective
Investors in National Fuel Gas had a tough year, with a total loss of 1.4% (including dividends), against a market gain of about 23%. However, keep in mind that even the best stocks will sometimes underperform the market over a twelve month period. However, the loss over the last year isn't as bad as the 1.5% per annum loss investors have suffered over the last half decade. We would want clear information suggesting the company will grow, before taking the view that the share price will stabilize. It's always interesting to track share price performance over the longer term. But to understand National Fuel Gas better, we need to consider many other factors. Even so, be aware that National Fuel Gas is showing 5 warning signs in our investment analysis , you should know about...
We will like National Fuel Gas better if we see some big insider buys. While we wait, check out this free list of growing companies with considerable, recent, insider buying.
Please note, the market returns quoted in this article reflect the market weighted average returns of stocks that currently trade on US exchanges.
This article by Simply Wall St is general in nature. It does not constitute a recommendation to buy or sell any stock, and does not take account of your objectives, or your financial situation. We aim to bring you long-term focused analysis driven by fundamental data. Note that our analysis may not factor in the latest price-sensitive company announcements or qualitative material. Simply Wall St has no position in any stocks mentioned.
Have feedback on this article? Concerned about the content? Get in touch with us directly. Alternatively, email editorial-team@simplywallst.com.
