
 Yahoo Finance
 Read This Before You Buy REX American Resources Corporation (NYSE:REX) Because Of Its P/E Ratio

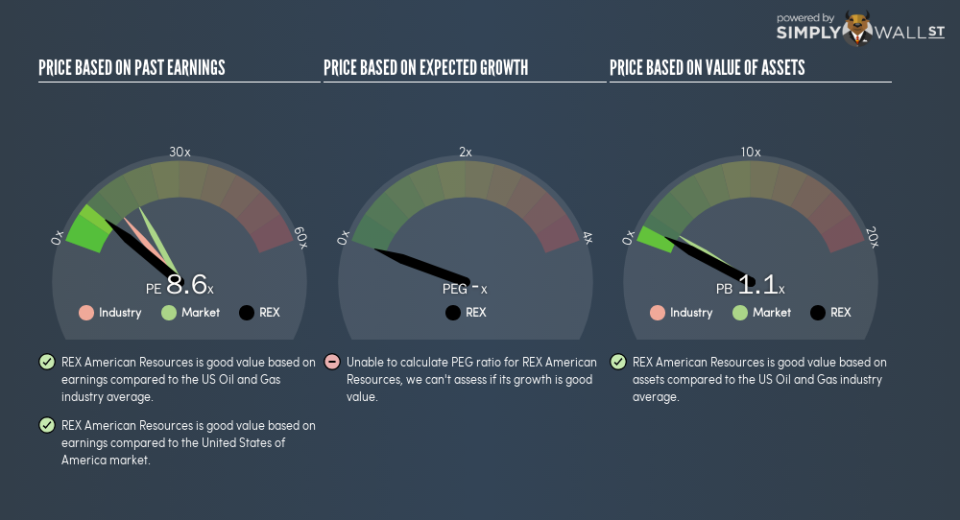
The goal of this article is to teach you how to use price to earnings ratios (P/E ratios). We’ll look at REX American Resources Corporation’s (NYSE:REX) P/E ratio and reflect on what it tells us about the company’s share price. REX American Resources has a P/E ratio of 8.62, based on the last twelve months. That means that at current prices, buyers pay $8.62 for every $1 in trailing yearly profits.
See our latest analysis for REX American Resources
How Do I Calculate A Price To Earnings Ratio?
The formula for P/E is:
Price to Earnings Ratio = Price per Share ÷ Earnings per Share (EPS)
Or for REX American Resources:
P/E of 8.62 = $66.93 ÷ $7.77 (Based on the trailing twelve months to July 2018.)
Is A High Price-to-Earnings Ratio Good?
A higher P/E ratio means that investors are paying a higher price for each $1 of company earnings. That is not a good or a bad thing per se, but a high P/E does imply buyers are optimistic about the future.
How Growth Rates Impact P/E Ratios
Earnings growth rates have a big influence on P/E ratios. When earnings grow, the ‘E’ increases, over time. That means unless the share price increases, the P/E will reduce in a few years. So while a stock may look expensive based on past earnings, it could be cheap based on future earnings.
REX American Resources increased earnings per share by a whopping 78% last year. And earnings per share have improved by 2.1% annually, over the last five years. With that performance, I would expect it to have an above average P/E ratio.
How Does REX American Resources’s P/E Ratio Compare To Its Peers?
The P/E ratio essentially measures market expectations of a company. The image below shows that REX American Resources has a lower P/E than the average (12.7) P/E for companies in the oil and gas industry.
Its relatively low P/E ratio indicates that REX American Resources shareholders think it will struggle to do as well as other companies in its industry classification. While current expectations are low, the stock could be undervalued if the situation is better than the market assumes. You should delve deeper. I like to check if company insiders have been buying or selling.
Remember: P/E Ratios Don’t Consider The Balance Sheet
It’s important to note that the P/E ratio considers the market capitalization, not the enterprise value. That means it doesn’t take debt or cash into account. Hypothetically, a company could reduce its future P/E ratio by spending its cash (or taking on debt) to achieve higher earnings.
Spending on growth might be good or bad a few years later, but the point is that the P/E ratio does not account for the option (or lack thereof).
REX American Resources’s Balance Sheet
REX American Resources has net cash of US$186m. That should lead to a higher P/E than if it did have debt, because its strong balance sheets gives it more options.
The Verdict On REX American Resources’s P/E Ratio
REX American Resources has a P/E of 8.6. That’s below the average in the US market, which is 17.9. Not only should the net cash position reduce risk, but the recent growth has been impressive. The below average P/E ratio suggests that market participants don’t believe the strong growth will continue.
Investors have an opportunity when market expectations about a stock are wrong. As value investor Benjamin Graham famously said, ‘In the short run, the market is a voting machine but in the long run, it is a weighing machine.’ We don’t have analyst forecasts, but you could get a better understanding of its growth by checking out this more detailed historical graph of earnings, revenue and cash flow.
Of course, you might find a fantastic investment by looking at a few good candidates. So take a peek at this free list of companies with modest (or no) debt, trading on a P/E below 20.
To help readers see past the short term volatility of the financial market, we aim to bring you a long-term focused research analysis purely driven by fundamental data. Note that our analysis does not factor in the latest price-sensitive company announcements.
The author is an independent contributor and at the time of publication had no position in the stocks mentioned. For errors that warrant correction please contact the editor at editorial-team@simplywallst.com.
