
 Yahoo Finance
 Read This Before You Buy National Presto Industries, Inc. (NYSE:NPK) Because Of Its P/E Ratio

Want to participate in a short research study? Help shape the future of investing tools and you could win a $250 gift card!
This article is written for those who want to get better at using price to earnings ratios (P/E ratios). To keep it practical, we'll show how National Presto Industries, Inc.'s (NYSE:NPK) P/E ratio could help you assess the value on offer. National Presto Industries has a price to earnings ratio of 18.62, based on the last twelve months. That corresponds to an earnings yield of approximately 5.4%.
Check out our latest analysis for National Presto Industries
How Do I Calculate A Price To Earnings Ratio?
The formula for price to earnings is:
Price to Earnings Ratio = Share Price ÷ Earnings per Share (EPS)
Or for National Presto Industries:
P/E of 18.62 = $92.57 ÷ $4.97 (Based on the trailing twelve months to March 2019.)
Is A High Price-to-Earnings Ratio Good?
The higher the P/E ratio, the higher the price tag of a business, relative to its trailing earnings. That isn't a good or a bad thing on its own, but a high P/E means that buyers have a higher opinion of the business's prospects, relative to stocks with a lower P/E.
How Growth Rates Impact P/E Ratios
If earnings fall then in the future the 'E' will be lower. That means unless the share price falls, the P/E will increase in a few years. Then, a higher P/E might scare off shareholders, pushing the share price down.
National Presto Industries's earnings per share fell by 22% in the last twelve months. And over the longer term (5 years) earnings per share have decreased 2.5% annually. This might lead to muted expectations.
Does National Presto Industries Have A Relatively High Or Low P/E For Its Industry?
The P/E ratio essentially measures market expectations of a company. The image below shows that National Presto Industries has a lower P/E than the average (22.7) P/E for companies in the aerospace & defense industry.
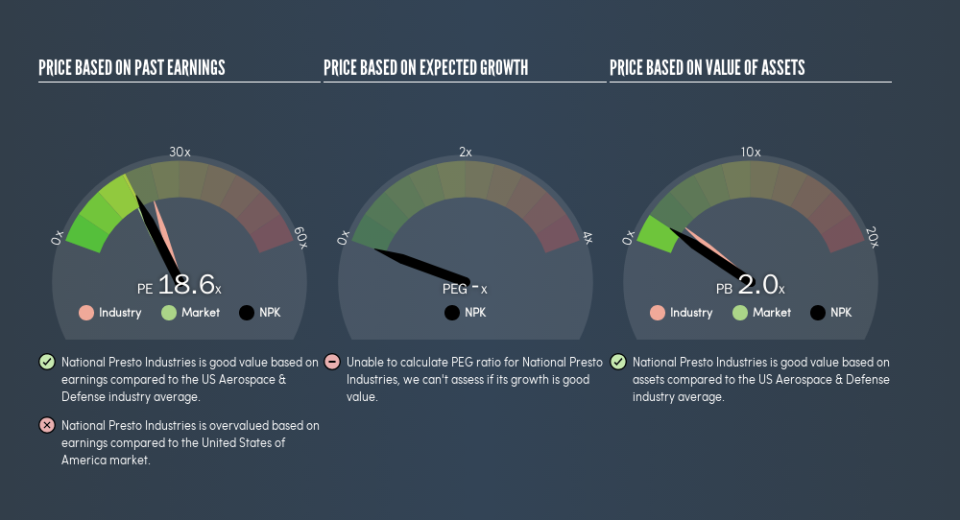
This suggests that market participants think National Presto Industries will underperform other companies in its industry. Many investors like to buy stocks when the market is pessimistic about their prospects. If you consider the stock interesting, further research is recommended. For example, I often monitor director buying and selling.
Don't Forget: The P/E Does Not Account For Debt or Bank Deposits
The 'Price' in P/E reflects the market capitalization of the company. Thus, the metric does not reflect cash or debt held by the company. Theoretically, a business can improve its earnings (and produce a lower P/E in the future) by investing in growth. That means taking on debt (or spending its cash).
Such spending might be good or bad, overall, but the key point here is that you need to look at debt to understand the P/E ratio in context.
Is Debt Impacting National Presto Industries's P/E?
With net cash of US$160m, National Presto Industries has a very strong balance sheet, which may be important for its business. Having said that, at 25% of its market capitalization the cash hoard would contribute towards a higher P/E ratio.
The Verdict On National Presto Industries's P/E Ratio
National Presto Industries's P/E is 18.6 which is about average (17.6) in the US market. While the lack of recent growth is probably muting optimism, the healthy balance sheet means the company retains potential for future growth. So it's not surprising to see it trade on a P/E roughly in line with the market.
Investors have an opportunity when market expectations about a stock are wrong. As value investor Benjamin Graham famously said, 'In the short run, the market is a voting machine but in the long run, it is a weighing machine.' Although we don't have analyst forecasts, you might want to assess this data-rich visualization of earnings, revenue and cash flow.
You might be able to find a better buy than National Presto Industries. If you want a selection of possible winners, check out this free list of interesting companies that trade on a P/E below 20 (but have proven they can grow earnings).
We aim to bring you long-term focused research analysis driven by fundamental data. Note that our analysis may not factor in the latest price-sensitive company announcements or qualitative material.
If you spot an error that warrants correction, please contact the editor at editorial-team@simplywallst.com. This article by Simply Wall St is general in nature. It does not constitute a recommendation to buy or sell any stock, and does not take account of your objectives, or your financial situation. Simply Wall St has no position in the stocks mentioned. Thank you for reading.
