
 Yahoo Finance
 REA Group (ASX:REA) Might Become A Compounding Machine
What trends should we look for it we want to identify stocks that can multiply in value over the long term? One common approach is to try and find a company with returns on capital employed (ROCE) that are increasing, in conjunction with a growing amount of capital employed. This shows us that it's a compounding machine, able to continually reinvest its earnings back into the business and generate higher returns. With that in mind, the ROCE of REA Group (ASX:REA) looks attractive right now, so lets see what the trend of returns can tell us.
What is Return On Capital Employed (ROCE)?
If you haven't worked with ROCE before, it measures the 'return' (pre-tax profit) a company generates from capital employed in its business. The formula for this calculation on REA Group is:
Return on Capital Employed = Earnings Before Interest and Tax (EBIT) ÷ (Total Assets - Current Liabilities)
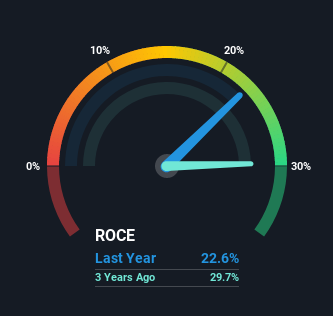
0.23 = AU$457m ÷ (AU$2.4b - AU$352m) (Based on the trailing twelve months to June 2021).
Thus, REA Group has an ROCE of 23%. In absolute terms that's a great return and it's even better than the Interactive Media and Services industry average of 16%.
Check out our latest analysis for REA Group
In the above chart we have measured REA Group's prior ROCE against its prior performance, but the future is arguably more important. If you're interested, you can view the analysts predictions in our free report on analyst forecasts for the company.
How Are Returns Trending?
We'd be pretty happy with returns on capital like REA Group. The company has employed 61% more capital in the last five years, and the returns on that capital have remained stable at 23%. Returns like this are the envy of most businesses and given it has repeatedly reinvested at these rates, that's even better. If REA Group can keep this up, we'd be very optimistic about its future.
The Key Takeaway
In short, we'd argue REA Group has the makings of a multi-bagger since its been able to compound its capital at very profitable rates of return. On top of that, the stock has rewarded shareholders with a remarkable 240% return to those who've held over the last five years. So even though the stock might be more "expensive" than it was before, we think the strong fundamentals warrant this stock for further research.
Before jumping to any conclusions though, we need to know what value we're getting for the current share price. That's where you can check out our FREE intrinsic value estimation that compares the share price and estimated value.
If you want to search for more stocks that have been earning high returns, check out this free list of stocks with solid balance sheets that are also earning high returns on equity.
This article by Simply Wall St is general in nature. We provide commentary based on historical data and analyst forecasts only using an unbiased methodology and our articles are not intended to be financial advice. It does not constitute a recommendation to buy or sell any stock, and does not take account of your objectives, or your financial situation. We aim to bring you long-term focused analysis driven by fundamental data. Note that our analysis may not factor in the latest price-sensitive company announcements or qualitative material. Simply Wall St has no position in any stocks mentioned.
Have feedback on this article? Concerned about the content? Get in touch with us directly. Alternatively, email editorial-team (at) simplywallst.com.
