
 Yahoo Finance
 Our Take On Raymond James Financial, Inc.'s (NYSE:RJF) CEO Salary

Want to participate in a short research study? Help shape the future of investing tools and you could win a $250 gift card!
Paul Reilly has been the CEO of Raymond James Financial, Inc. (NYSE:RJF) since 2010. This analysis aims first to contrast CEO compensation with other large companies. Then we'll look at a snap shot of the business growth. Third, we'll reflect on the total return to shareholders over three years, as a second measure of business performance. This process should give us an idea about how appropriately the CEO is paid.
See our latest analysis for Raymond James Financial
How Does Paul Reilly's Compensation Compare With Similar Sized Companies?
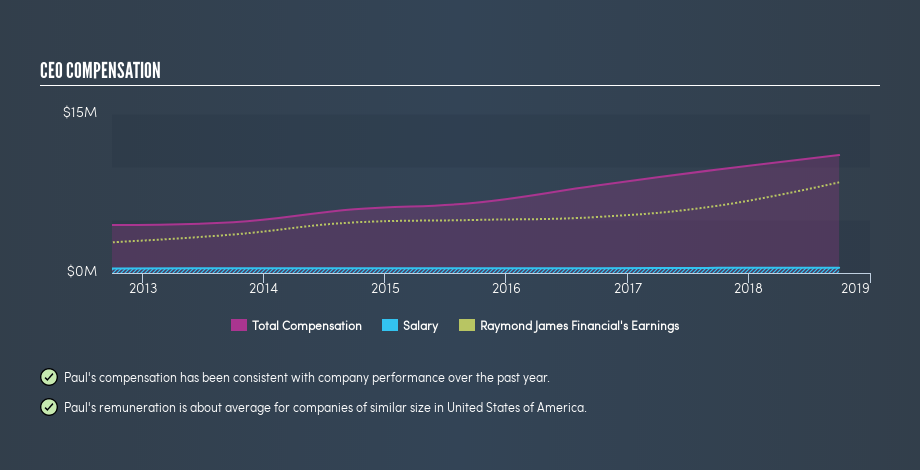
Our data indicates that Raymond James Financial, Inc. is worth US$12b, and total annual CEO compensation is US$11m. (This figure is for the year to September 2018). While this analysis focuses on total compensation, it's worth noting the salary is lower, valued at US$500k. We looked at a group of companies with market capitalizations over US$8.0b and the median CEO total compensation was US$11m. (We took a wide range because the CEOs of massive companies tend to be paid similar amounts - even though some are quite a bit bigger than others).
So Paul Reilly is paid around the average of the companies we looked at. While this data point isn't particularly informative alone, it gains more meaning when considered with business performance.
The graphic below shows how CEO compensation at Raymond James Financial has changed from year to year.
Is Raymond James Financial, Inc. Growing?
On average over the last three years, Raymond James Financial, Inc. has grown earnings per share (EPS) by 25% each year (using a line of best fit). In the last year, its revenue is up 9.1%.
This shows that the company has improved itself over the last few years. Good news for shareholders. It's good to see a bit of revenue growth, as this suggests the business is able to grow sustainably. Shareholders might be interested in this free visualization of analyst forecasts.
Has Raymond James Financial, Inc. Been A Good Investment?
I think that the total shareholder return of 68%, over three years, would leave most Raymond James Financial, Inc. shareholders smiling. As a result, some may believe the CEO should be paid more than is normal for companies of similar size.
In Summary...
Paul Reilly is paid around what is normal the leaders of larger companies.
Shareholders would surely be happy to see that shareholder returns have been great, and the earnings per share are up. Although the pay is a normal amount, some shareholders probably consider it fair or modest, given the good performance of the stock. So you may want to check if insiders are buying Raymond James Financial shares with their own money (free access).
Arguably, business quality is much more important than CEO compensation levels. So check out this free list of interesting companies, that have HIGH return on equity and low debt.
We aim to bring you long-term focused research analysis driven by fundamental data. Note that our analysis may not factor in the latest price-sensitive company announcements or qualitative material.
If you spot an error that warrants correction, please contact the editor at editorial-team@simplywallst.com. This article by Simply Wall St is general in nature. It does not constitute a recommendation to buy or sell any stock, and does not take account of your objectives, or your financial situation. Simply Wall St has no position in the stocks mentioned. Thank you for reading.
