
 Yahoo Finance
 Should You Like Questerre Energy Corporation’s (TSE:QEC) High Return On Capital Employed?

Today we are going to look at Questerre Energy Corporation (TSE:QEC) to see whether it might be an attractive investment prospect. In particular, we'll consider its Return On Capital Employed (ROCE), as that can give us insight into how profitably the company is able to employ capital in its business.
Firstly, we'll go over how we calculate ROCE. Next, we'll compare it to others in its industry. And finally, we'll look at how its current liabilities are impacting its ROCE.
Return On Capital Employed (ROCE): What is it?
ROCE is a measure of a company's yearly pre-tax profit (its return), relative to the capital employed in the business. All else being equal, a better business will have a higher ROCE. Overall, it is a valuable metric that has its flaws. Author Edwin Whiting says to be careful when comparing the ROCE of different businesses, since 'No two businesses are exactly alike.
How Do You Calculate Return On Capital Employed?
The formula for calculating the return on capital employed is:
Return on Capital Employed = Earnings Before Interest and Tax (EBIT) ÷ (Total Assets - Current Liabilities)
Or for Questerre Energy:
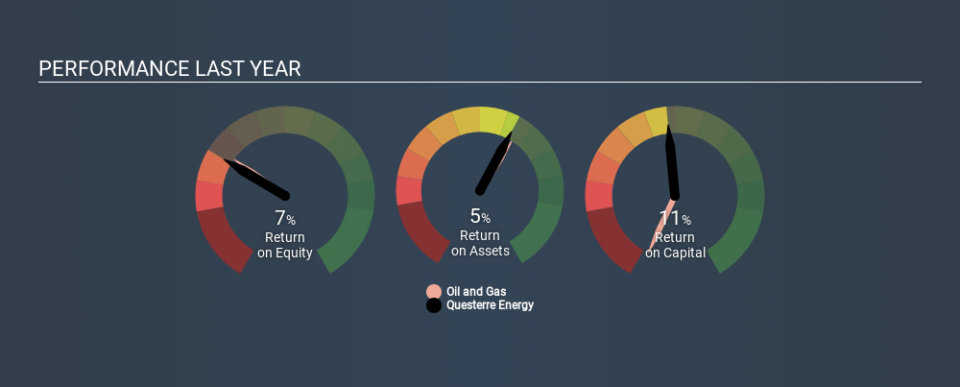
0.11 = CA$24m ÷ (CA$251m - CA$36m) (Based on the trailing twelve months to September 2019.)
So, Questerre Energy has an ROCE of 11%.
See our latest analysis for Questerre Energy
Does Questerre Energy Have A Good ROCE?
One way to assess ROCE is to compare similar companies. Questerre Energy's ROCE appears to be substantially greater than the 5.4% average in the Oil and Gas industry. We would consider this a positive, as it suggests it is using capital more effectively than other similar companies. Separate from Questerre Energy's performance relative to its industry, its ROCE in absolute terms looks satisfactory, and it may be worth researching in more depth.
Questerre Energy delivered an ROCE of 11%, which is better than 3 years ago, as was making losses back then. That implies the business has been improving. You can see in the image below how Questerre Energy's ROCE compares to its industry. Click to see more on past growth.
When considering this metric, keep in mind that it is backwards looking, and not necessarily predictive. Companies in cyclical industries can be difficult to understand using ROCE, as returns typically look high during boom times, and low during busts. This is because ROCE only looks at one year, instead of considering returns across a whole cycle. We note Questerre Energy could be considered a cyclical business. Since the future is so important for investors, you should check out our free report on analyst forecasts for Questerre Energy.
Do Questerre Energy's Current Liabilities Skew Its ROCE?
Liabilities, such as supplier bills and bank overdrafts, are referred to as current liabilities if they need to be paid within 12 months. Due to the way the ROCE equation works, having large bills due in the near term can make it look as though a company has less capital employed, and thus a higher ROCE than usual. To counteract this, we check if a company has high current liabilities, relative to its total assets.
Questerre Energy has total assets of CA$251m and current liabilities of CA$36m. Therefore its current liabilities are equivalent to approximately 14% of its total assets. A fairly low level of current liabilities is not influencing the ROCE too much.
What We Can Learn From Questerre Energy's ROCE
Overall, Questerre Energy has a decent ROCE and could be worthy of further research. Questerre Energy looks strong on this analysis, but there are plenty of other companies that could be a good opportunity . Here is a free list of companies growing earnings rapidly.
For those who like to find winning investments this free list of growing companies with recent insider purchasing, could be just the ticket.
If you spot an error that warrants correction, please contact the editor at editorial-team@simplywallst.com. This article by Simply Wall St is general in nature. It does not constitute a recommendation to buy or sell any stock, and does not take account of your objectives, or your financial situation. Simply Wall St has no position in the stocks mentioned.
We aim to bring you long-term focused research analysis driven by fundamental data. Note that our analysis may not factor in the latest price-sensitive company announcements or qualitative material. Thank you for reading.
