
 Yahoo Finance
 Quarto Group (LON:QRT) Is Doing The Right Things To Multiply Its Share Price
Finding a business that has the potential to grow substantially is not easy, but it is possible if we look at a few key financial metrics. Ideally, a business will show two trends; firstly a growing return on capital employed (ROCE) and secondly, an increasing amount of capital employed. If you see this, it typically means it's a company with a great business model and plenty of profitable reinvestment opportunities. With that in mind, we've noticed some promising trends at Quarto Group (LON:QRT) so let's look a bit deeper.
What Is Return On Capital Employed (ROCE)?
For those that aren't sure what ROCE is, it measures the amount of pre-tax profits a company can generate from the capital employed in its business. Analysts use this formula to calculate it for Quarto Group:
Return on Capital Employed = Earnings Before Interest and Tax (EBIT) ÷ (Total Assets - Current Liabilities)
0.19 = US$17m ÷ (US$157m - US$68m) (Based on the trailing twelve months to December 2021).
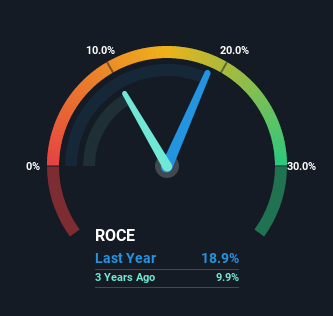
Thus, Quarto Group has an ROCE of 19%. On its own, that's a standard return, however it's much better than the 12% generated by the Media industry.
Check out our latest analysis for Quarto Group
While the past is not representative of the future, it can be helpful to know how a company has performed historically, which is why we have this chart above. If you're interested in investigating Quarto Group's past further, check out this free graph of past earnings, revenue and cash flow.
The Trend Of ROCE
We're pretty happy with how the ROCE has been trending at Quarto Group. We found that the returns on capital employed over the last five years have risen by 55%. That's not bad because this tells for every dollar invested (capital employed), the company is increasing the amount earned from that dollar. Speaking of capital employed, the company is actually utilizing 34% less than it was five years ago, which can be indicative of a business that's improving its efficiency. Quarto Group may be selling some assets so it's worth investigating if the business has plans for future investments to increase returns further still.
On a separate but related note, it's important to know that Quarto Group has a current liabilities to total assets ratio of 43%, which we'd consider pretty high. This effectively means that suppliers (or short-term creditors) are funding a large portion of the business, so just be aware that this can introduce some elements of risk. While it's not necessarily a bad thing, it can be beneficial if this ratio is lower.
In Conclusion...
From what we've seen above, Quarto Group has managed to increase it's returns on capital all the while reducing it's capital base. Investors may not be impressed by the favorable underlying trends yet because over the last five years the stock has only returned 22% to shareholders. Given that, we'd look further into this stock in case it has more traits that could make it multiply in the long term.
On a final note, we've found 1 warning sign for Quarto Group that we think you should be aware of.
For those who like to invest in solid companies, check out this free list of companies with solid balance sheets and high returns on equity.
Have feedback on this article? Concerned about the content? Get in touch with us directly. Alternatively, email editorial-team (at) simplywallst.com.
This article by Simply Wall St is general in nature. We provide commentary based on historical data and analyst forecasts only using an unbiased methodology and our articles are not intended to be financial advice. It does not constitute a recommendation to buy or sell any stock, and does not take account of your objectives, or your financial situation. We aim to bring you long-term focused analysis driven by fundamental data. Note that our analysis may not factor in the latest price-sensitive company announcements or qualitative material. Simply Wall St has no position in any stocks mentioned.
Join A Paid User Research Session
You’ll receive a US$30 Amazon Gift card for 1 hour of your time while helping us build better investing tools for the individual investors like yourself. Sign up here
