
 Yahoo Finance
 Protech Home Medical Corp.'s (CVE:PTQ) Earnings Dropped -8.1%, How Did It Fare Against The Industry?

After looking at Protech Home Medical Corp.'s (TSXV:PTQ) latest earnings announcement (30 September 2019), I found it useful to revisit the company's performance in the past couple of years and assess this against the most recent figures. As a long term investor, I pay close attention to earnings trend, rather than the figures published at one point in time. I also compare against an industry benchmark to check whether Protech Home Medical's performance has been impacted by industry movements. In this article I briefly touch on my key findings.
See our latest analysis for Protech Home Medical
Commentary On PTQ's Past Performance
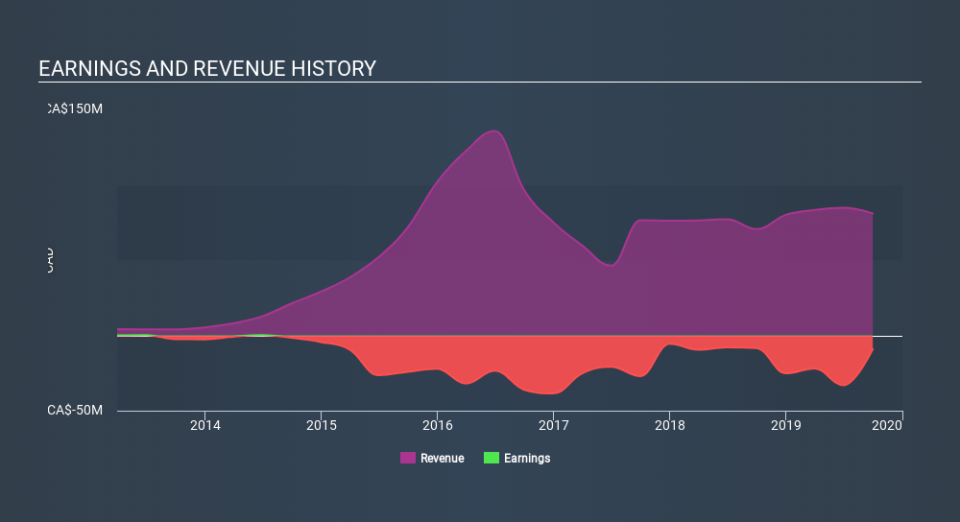
PTQ is loss-making, with the most recent trailing twelve-month earnings of -CA$9.1m (from 30 September 2019), which compared to last year has become more negative. However, the company's loss seem to be contracting over the medium term, with the five-year earnings average of -CA$15.5m. Each year, for the past five years PTQ has seen an annual increase in operating expense growth, outpacing revenue growth of 7.7%, on average. This adverse movement is a driver of the company's inability to reach breakeven.
Looking at growth from a sector-level, the Canadian healthcare industry has been relatively flat in terms of earnings growth over the previous few years. This growth is a median of profitable companies of 7 Healthcare companies in CA including Extendicare, CRH Medical and Sienna Senior Living. This suggests that any recent headwind the industry is facing, it’s hitting Protech Home Medical harder than its peers.
Given that Protech Home Medical is currently unprofitable, with operating expenses (opex) growing year-on-year at 4.4%, it may need to raise more cash over the next year. It currently has CA$13m in cash and short-term investments, however, opex (SG&A and one-year R&D) reachedCA$45m in the latest twelve months. Even though this is analysis is fairly basic, and Protech Home Medical still can cut its overhead in the near future, or raise debt capital instead of coming to equity markets, the outcome of this analysis still gives us an idea of the company’s timeline and when things will have to start changing, since its current operation is unsustainable.
What does this mean?
Protech Home Medical's track record can be a valuable insight into its earnings performance, but it certainly doesn't tell the whole story. With companies that are currently loss-making, it is always hard to forecast what will happen in the future and when. The most valuable step is to examine company-specific issues Protech Home Medical may be facing and whether management guidance has steadily been met in the past. I recommend you continue to research Protech Home Medical to get a better picture of the stock by looking at:
Future Outlook: What are well-informed industry analysts predicting for PTQ’s future growth? Take a look at our free research report of analyst consensus for PTQ’s outlook.
Financial Health: Are PTQ’s operations financially sustainable? Balance sheets can be hard to analyze, which is why we’ve done it for you. Check out our financial health checks here.
Other High-Performing Stocks: Are there other stocks that provide better prospects with proven track records? Explore our free list of these great stocks here.
NB: Figures in this article are calculated using data from the trailing twelve months from 30 September 2019. This may not be consistent with full year annual report figures.
If you spot an error that warrants correction, please contact the editor at editorial-team@simplywallst.com. This article by Simply Wall St is general in nature. It does not constitute a recommendation to buy or sell any stock, and does not take account of your objectives, or your financial situation. Simply Wall St has no position in the stocks mentioned.
We aim to bring you long-term focused research analysis driven by fundamental data. Note that our analysis may not factor in the latest price-sensitive company announcements or qualitative material. Thank you for reading.
