
 Yahoo Finance
 Is Prodigy Ventures Inc.’s (CVE:PGV) CEO Paid At A Competitive Rate?

In 2015 Tom Beckerman was appointed CEO of Prodigy Ventures Inc. (CVE:PGV). This analysis aims first to contrast CEO compensation with other companies that have similar market capitalization. Next, we’ll consider growth that the business demonstrates. And finally – as a second measure of performance – we will look at the returns shareholders have received over the last few years. This method should give us information to assess how appropriately the company pays the CEO.
See our latest analysis for Prodigy Ventures
Want to help shape the future of investing tools and platforms? Take the survey and be part of one of the most advanced studies of stock market investors to date.
How Does Tom Beckerman’s Compensation Compare With Similar Sized Companies?
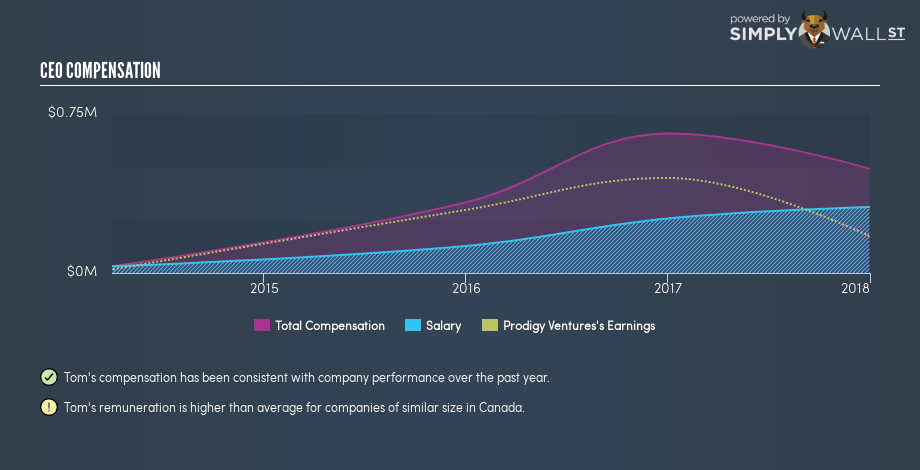
According to our data, Prodigy Ventures Inc. has a market capitalization of CA$20m, and pays its CEO total annual compensation worth CA$492k. (This figure is for the year to 2017). We think total compensation is more important but we note that the CEO salary is lower, at CA$311k. We took a group of companies with market capitalizations below CA$268m, and calculated the median CEO compensation to be CA$158k.
Thus we can conclude that Tom Beckerman receives more in total compensation than the median of a group of companies in the same market, and of similar size to Prodigy Ventures Inc.. However, this doesn’t necessarily mean the pay is too high. We can better assess whether the pay is overly generous by looking into the underlying business performance.
You can see a visual representation of the CEO compensation at Prodigy Ventures, below.
Is Prodigy Ventures Inc. Growing?
Prodigy Ventures Inc. has reduced its earnings per share by an average of 38% a year, over the last three years. In the last year, its revenue is up 28%.
Investors should note that, over three years, earnings per share are down. But on the other hand, revenue growth is strong, suggesting a brighter future. These two metric are moving in different directions, so while it’s hard to be confident judging performance, we think the stock is worth watching.
Although we don’t have analyst forecasts, shareholders might want to examine this detailed historical graph of earnings, revenue and cash flow.
Has Prodigy Ventures Inc. Been A Good Investment?
I think that the total shareholder return of 38%, over three years, would leave most Prodigy Ventures Inc. shareholders smiling. As a result, some may believe the CEO should be paid more than is normal for companies of similar size.
In Summary…
We compared total CEO remuneration at Prodigy Ventures Inc. with the amount paid at companies with a similar market capitalization. Our data suggests that it pays above the median CEO pay within that group.
Over the last three years returns to investors have been great, though we might have liked stronger business growth. Considering this fine result for investors, we daresay the CEO compensation might be apt. Shareholders may want to check for free if Prodigy Ventures insiders are buying or selling shares.
Or you might prefer this data-rich interactive visualization of historic revenue and earnings.
To help readers see past the short term volatility of the financial market, we aim to bring you a long-term focused research analysis purely driven by fundamental data. Note that our analysis does not factor in the latest price-sensitive company announcements.
The author is an independent contributor and at the time of publication had no position in the stocks mentioned. For errors that warrant correction please contact the editor at editorial-team@simplywallst.com.