
 Yahoo Finance
 PrairieSky Royalty Ltd.'s (TSE:PSK) Stock Financial Prospects Look Bleak: Should Shareholders Be Prepared For A Share Price Correction?
Most readers would already know that PrairieSky Royalty's (TSE:PSK) stock increased by 9.8% over the past three months. However, its weak financial performance indicators makes us a bit doubtful if that trend could continue. In this article, we decided to focus on PrairieSky Royalty's ROE.
Return on equity or ROE is an important factor to be considered by a shareholder because it tells them how effectively their capital is being reinvested. Put another way, it reveals the company's success at turning shareholder investments into profits.
View our latest analysis for PrairieSky Royalty
How To Calculate Return On Equity?
The formula for ROE is:
Return on Equity = Net Profit (from continuing operations) ÷ Shareholders' Equity
So, based on the above formula, the ROE for PrairieSky Royalty is:
6.4% = CA$169m ÷ CA$2.6b (Based on the trailing twelve months to March 2022).
The 'return' is the yearly profit. One way to conceptualize this is that for each CA$1 of shareholders' capital it has, the company made CA$0.06 in profit.
What Has ROE Got To Do With Earnings Growth?
So far, we've learned that ROE is a measure of a company's profitability. Depending on how much of these profits the company reinvests or "retains", and how effectively it does so, we are then able to assess a company’s earnings growth potential. Assuming everything else remains unchanged, the higher the ROE and profit retention, the higher the growth rate of a company compared to companies that don't necessarily bear these characteristics.
PrairieSky Royalty's Earnings Growth And 6.4% ROE
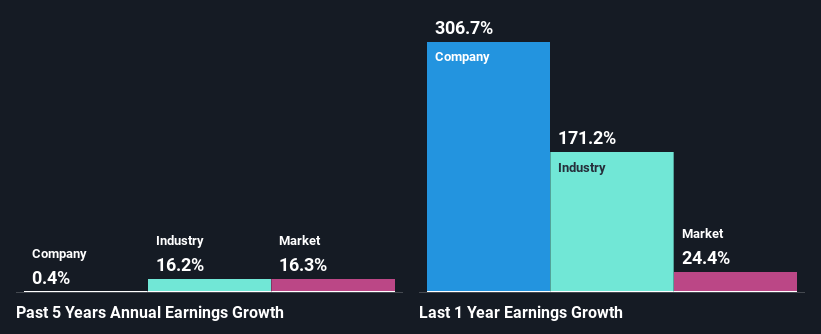
When you first look at it, PrairieSky Royalty's ROE doesn't look that attractive. A quick further study shows that the company's ROE doesn't compare favorably to the industry average of 23% either. Hence, the flat earnings seen by PrairieSky Royalty over the past five years could probably be the result of it having a lower ROE.
As a next step, we compared PrairieSky Royalty's net income growth with the industry and were disappointed to see that the company's growth is lower than the industry average growth of 16% in the same period.
Earnings growth is a huge factor in stock valuation. What investors need to determine next is if the expected earnings growth, or the lack of it, is already built into the share price. By doing so, they will have an idea if the stock is headed into clear blue waters or if swampy waters await. Has the market priced in the future outlook for PSK? You can find out in our latest intrinsic value infographic research report.
Is PrairieSky Royalty Efficiently Re-investing Its Profits?
PrairieSky Royalty's very high three-year median payout ratio of 174% suggests that the company is paying its shareholders more than what it is earning. The absence of growth in PrairieSky Royalty's earnings therefore, doesn't come as a surprise. Paying a dividend beyond their means is usually not viable over the long term. This is quite a risky position to be in. You can see the 3 risks we have identified for PrairieSky Royalty by visiting our risks dashboard for free on our platform here.
In addition, PrairieSky Royalty has been paying dividends over a period of eight years suggesting that keeping up dividend payments is way more important to the management even if it comes at the cost of business growth. Our latest analyst data shows that the future payout ratio of the company is expected to drop to 41% over the next three years.
Summary
In total, we would have a hard think before deciding on any investment action concerning PrairieSky Royalty. Specifically, it has shown quite an unsatisfactory performance as far as earnings growth is concerned, and a poor ROE and an equally poor rate of reinvestment seem to be the reason behind this inadequate performance. So far, we've only made a quick discussion around the company's earnings growth. You can do your own research on PrairieSky Royalty and see how it has performed in the past by looking at this FREE detailed graph of past earnings, revenue and cash flows.
Have feedback on this article? Concerned about the content? Get in touch with us directly. Alternatively, email editorial-team (at) simplywallst.com.
This article by Simply Wall St is general in nature. We provide commentary based on historical data and analyst forecasts only using an unbiased methodology and our articles are not intended to be financial advice. It does not constitute a recommendation to buy or sell any stock, and does not take account of your objectives, or your financial situation. We aim to bring you long-term focused analysis driven by fundamental data. Note that our analysis may not factor in the latest price-sensitive company announcements or qualitative material. Simply Wall St has no position in any stocks mentioned.
