
 Yahoo Finance
 What Is Points International's (TSE:PTS) P/E Ratio After Its Share Price Rocketed?

Points International (TSE:PTS) shares have continued recent momentum with a 32% gain in the last month alone. Looking back a bit further, we're also happy to report the stock is up 74% in the last year.
Assuming no other changes, a sharply higher share price makes a stock less attractive to potential buyers. In the long term, share prices tend to follow earnings per share, but in the short term prices bounce around in response to short term factors (which are not always obvious). So some would prefer to hold off buying when there is a lot of optimism towards a stock. One way to gauge market expectations of a stock is to look at its Price to Earnings Ratio (PE Ratio). Investors have optimistic expectations of companies with higher P/E ratios, compared to companies with lower P/E ratios.
View our latest analysis for Points International
How Does Points International's P/E Ratio Compare To Its Peers?
We can tell from its P/E ratio of 23.06 that sentiment around Points International isn't particularly high. If you look at the image below, you can see Points International has a lower P/E than the average (29.9) in the online retail industry classification.
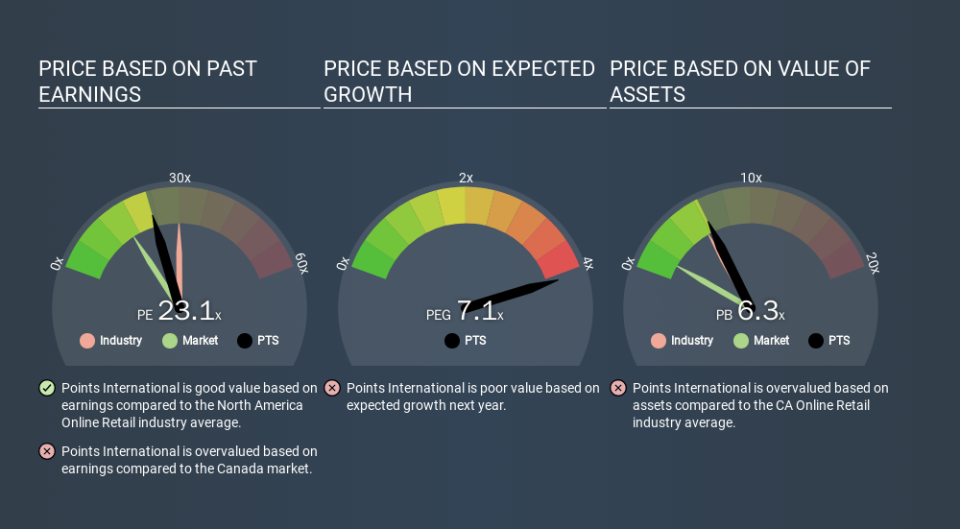
Its relatively low P/E ratio indicates that Points International shareholders think it will struggle to do as well as other companies in its industry classification. Many investors like to buy stocks when the market is pessimistic about their prospects. If you consider the stock interesting, further research is recommended. For example, I often monitor director buying and selling.
How Growth Rates Impact P/E Ratios
Probably the most important factor in determining what P/E a company trades on is the earnings growth. Earnings growth means that in the future the 'E' will be higher. Therefore, even if you pay a high multiple of earnings now, that multiple will become lower in the future. A lower P/E should indicate the stock is cheap relative to others -- and that may attract buyers.
In the last year, Points International grew EPS like Taylor Swift grew her fan base back in 2010; the 76% gain was both fast and well deserved. The sweetener is that the annual five year growth rate of 18% is also impressive. So I'd be surprised if the P/E ratio was not above average.
A Limitation: P/E Ratios Ignore Debt and Cash In The Bank
It's important to note that the P/E ratio considers the market capitalization, not the enterprise value. Thus, the metric does not reflect cash or debt held by the company. Theoretically, a business can improve its earnings (and produce a lower P/E in the future) by investing in growth. That means taking on debt (or spending its cash).
Such expenditure might be good or bad, in the long term, but the point here is that the balance sheet is not reflected by this ratio.
So What Does Points International's Balance Sheet Tell Us?
With net cash of US$54m, Points International has a very strong balance sheet, which may be important for its business. Having said that, at 23% of its market capitalization the cash hoard would contribute towards a higher P/E ratio.
The Verdict On Points International's P/E Ratio
Points International trades on a P/E ratio of 23.1, which is above its market average of 15.9. Its net cash position is the cherry on top of its superb EPS growth. To us, this is the sort of company that we would expect to carry an above average price tag (relative to earnings). What is very clear is that the market has become significantly more optimistic about Points International over the last month, with the P/E ratio rising from 17.5 back then to 23.1 today. If you like to buy stocks that have recently impressed the market, then this one might be a candidate; but if you prefer to invest when there is 'blood in the streets', then you may feel the opportunity has passed.
Investors have an opportunity when market expectations about a stock are wrong. If the reality for a company is better than it expects, you can make money by buying and holding for the long term. So this free report on the analyst consensus forecasts could help you make a master move on this stock.
But note: Points International may not be the best stock to buy. So take a peek at this free list of interesting companies with strong recent earnings growth (and a P/E ratio below 20).
If you spot an error that warrants correction, please contact the editor at editorial-team@simplywallst.com. This article by Simply Wall St is general in nature. It does not constitute a recommendation to buy or sell any stock, and does not take account of your objectives, or your financial situation. Simply Wall St has no position in the stocks mentioned.
We aim to bring you long-term focused research analysis driven by fundamental data. Note that our analysis may not factor in the latest price-sensitive company announcements or qualitative material. Thank you for reading.
