
 Yahoo Finance
 What Can We Make Of Points International Ltd.’s (TSE:PTS) High Return On Capital?

Today we'll look at Points International Ltd. (TSE:PTS) and reflect on its potential as an investment. Specifically, we're going to calculate its Return On Capital Employed (ROCE), in the hopes of getting some insight into the business.
First, we'll go over how we calculate ROCE. Then we'll compare its ROCE to similar companies. And finally, we'll look at how its current liabilities are impacting its ROCE.
Understanding Return On Capital Employed (ROCE)
ROCE measures the amount of pre-tax profits a company can generate from the capital employed in its business. Generally speaking a higher ROCE is better. In brief, it is a useful tool, but it is not without drawbacks. Renowned investment researcher Michael Mauboussin has suggested that a high ROCE can indicate that 'one dollar invested in the company generates value of more than one dollar'.
So, How Do We Calculate ROCE?
Analysts use this formula to calculate return on capital employed:
Return on Capital Employed = Earnings Before Interest and Tax (EBIT) ÷ (Total Assets - Current Liabilities)
Or for Points International:
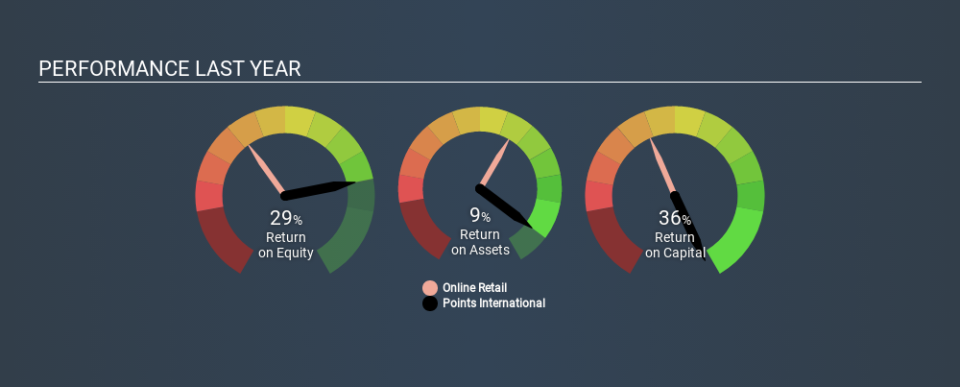
0.36 = US$16m ÷ (US$117m - US$74m) (Based on the trailing twelve months to September 2019.)
Therefore, Points International has an ROCE of 36%.
View our latest analysis for Points International
Is Points International's ROCE Good?
ROCE is commonly used for comparing the performance of similar businesses. In our analysis, Points International's ROCE is meaningfully higher than the 7.8% average in the Online Retail industry. We consider this a positive sign, because it suggests it uses capital more efficiently than similar companies. Setting aside the comparison to its industry for a moment, Points International's ROCE in absolute terms currently looks quite high.
We can see that, Points International currently has an ROCE of 36% compared to its ROCE 3 years ago, which was 9.2%. This makes us think about whether the company has been reinvesting shrewdly. You can click on the image below to see (in greater detail) how Points International's past growth compares to other companies.
Remember that this metric is backwards looking - it shows what has happened in the past, and does not accurately predict the future. ROCE can be misleading for companies in cyclical industries, with returns looking impressive during the boom times, but very weak during the busts. ROCE is, after all, simply a snap shot of a single year. What happens in the future is pretty important for investors, so we have prepared a free report on analyst forecasts for Points International.
Points International's Current Liabilities And Their Impact On Its ROCE
Liabilities, such as supplier bills and bank overdrafts, are referred to as current liabilities if they need to be paid within 12 months. The ROCE equation subtracts current liabilities from capital employed, so a company with a lot of current liabilities appears to have less capital employed, and a higher ROCE than otherwise. To counteract this, we check if a company has high current liabilities, relative to its total assets.
Points International has total assets of US$117m and current liabilities of US$74m. Therefore its current liabilities are equivalent to approximately 63% of its total assets. While a high level of current liabilities boosts its ROCE, Points International's returns are still very good.
Our Take On Points International's ROCE
In my book, this business could be worthy of further research. Points International looks strong on this analysis, but there are plenty of other companies that could be a good opportunity . Here is a free list of companies growing earnings rapidly.
Points International is not the only stock insiders are buying. So take a peek at this free list of growing companies with insider buying.
If you spot an error that warrants correction, please contact the editor at editorial-team@simplywallst.com. This article by Simply Wall St is general in nature. It does not constitute a recommendation to buy or sell any stock, and does not take account of your objectives, or your financial situation. Simply Wall St has no position in the stocks mentioned.
We aim to bring you long-term focused research analysis driven by fundamental data. Note that our analysis may not factor in the latest price-sensitive company announcements or qualitative material. Thank you for reading.
