
 Yahoo Finance
 Should You Be Pleased About The CEO Pay At Ooma, Inc.'s (NYSE:OOMA)

In 2009 Eric Stang was appointed CEO of Ooma, Inc. (NYSE:OOMA). This analysis aims first to contrast CEO compensation with other companies that have similar market capitalization. After that, we will consider the growth in the business. And finally - as a second measure of performance - we will look at the returns shareholders have received over the last few years. The aim of all this is to consider the appropriateness of CEO pay levels.
View our latest analysis for Ooma
How Does Eric Stang's Compensation Compare With Similar Sized Companies?
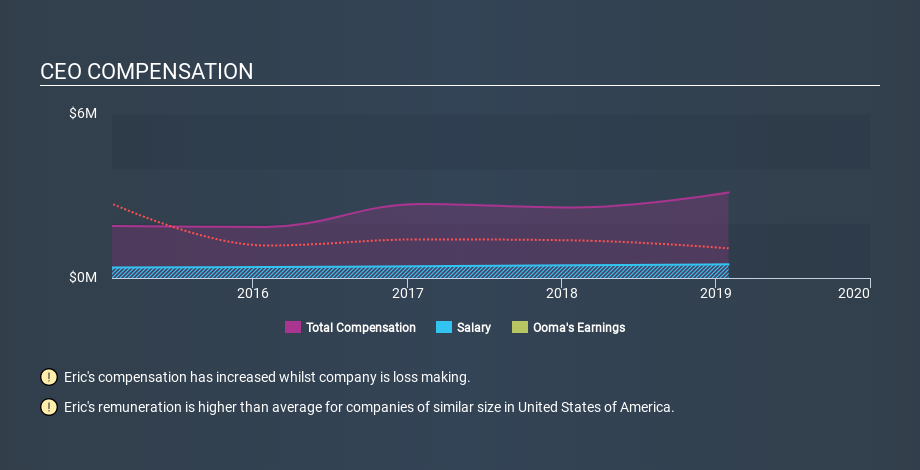
Our data indicates that Ooma, Inc. is worth US$268m, and total annual CEO compensation was reported as US$3.1m for the year to January 2019. While this analysis focuses on total compensation, it's worth noting the salary is lower, valued at US$501k. We further remind readers that the CEO may face performance requirements to receive the non-salary part of the total compensation. As part of our analysis we looked at companies in the same jurisdiction, with market capitalizations of US$100m to US$400m. The median total CEO compensation was US$1.1m.
Thus we can conclude that Eric Stang receives more in total compensation than the median of a group of companies in the same market, and of similar size to Ooma, Inc.. However, this doesn't necessarily mean the pay is too high. We can better assess whether the pay is overly generous by looking into the underlying business performance.
You can see a visual representation of the CEO compensation at Ooma, below.
Is Ooma, Inc. Growing?
Ooma, Inc. has reduced its earnings per share by an average of 5.9% a year, over the last three years (measured with a line of best fit). In the last year, its revenue is up 17%.
Sadly for shareholders, earnings per share are actually down, over three years. And while it's good to see some good revenue growth recently, the growth isn't really fast enough for me to put aside my concerns around earnings. These factors suggest that the business performance wouldn't really justify a high pay packet for the CEO. You might want to check this free visual report on analyst forecasts for future earnings.
Has Ooma, Inc. Been A Good Investment?
Most shareholders would probably be pleased with Ooma, Inc. for providing a total return of 34% over three years. So they may not be at all concerned if the CEO were to be paid more than is normal for companies around the same size.
In Summary...
We examined the amount Ooma, Inc. pays its CEO, and compared it to the amount paid by similar sized companies. We found that it pays well over the median amount paid in the benchmark group.
Earnings per share have not grown in three years, and the revenue growth fails to impress us. However, we can't argue with the strong returns to shareholders, over the same time period. So on this analysis we'd stop short of criticizing the level of CEO compensation. Shareholders may want to check for free if Ooma insiders are buying or selling shares.
Of course, you might find a fantastic investment by looking elsewhere. So take a peek at this free list of interesting companies.
If you spot an error that warrants correction, please contact the editor at editorial-team@simplywallst.com. This article by Simply Wall St is general in nature. It does not constitute a recommendation to buy or sell any stock, and does not take account of your objectives, or your financial situation. Simply Wall St has no position in the stocks mentioned.
We aim to bring you long-term focused research analysis driven by fundamental data. Note that our analysis may not factor in the latest price-sensitive company announcements or qualitative material. Thank you for reading.
