
 Yahoo Finance
 Pinning Down Intercontinental Exchange, Inc.'s (NYSE:ICE) P/E Is Difficult Right Now
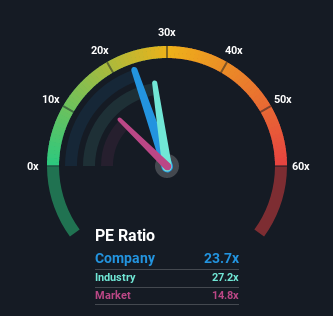
With a price-to-earnings (or "P/E") ratio of 23.7x Intercontinental Exchange, Inc. (NYSE:ICE) may be sending very bearish signals at the moment, given that almost half of all companies in the United States have P/E ratios under 14x and even P/E's lower than 8x are not unusual. Although, it's not wise to just take the P/E at face value as there may be an explanation why it's so lofty.
Intercontinental Exchange could be doing better as its earnings have been going backwards lately while most other companies have been seeing positive earnings growth. One possibility is that the P/E is high because investors think this poor earnings performance will turn the corner. If not, then existing shareholders may be extremely nervous about the viability of the share price.
Check out our latest analysis for Intercontinental Exchange
If you'd like to see what analysts are forecasting going forward, you should check out our free report on Intercontinental Exchange.
Does Growth Match The High P/E?
The only time you'd be truly comfortable seeing a P/E as steep as Intercontinental Exchange's is when the company's growth is on track to outshine the market decidedly.
Retrospectively, the last year delivered a frustrating 16% decrease to the company's bottom line. This has soured the latest three-year period, which nevertheless managed to deliver a decent 23% overall rise in EPS. Accordingly, while they would have preferred to keep the run going, shareholders would be roughly satisfied with the medium-term rates of earnings growth.
Turning to the outlook, the next three years should generate growth of 8.4% each year as estimated by the analysts watching the company. Meanwhile, the rest of the market is forecast to expand by 9.0% per annum, which is not materially different.
With this information, we find it interesting that Intercontinental Exchange is trading at a high P/E compared to the market. It seems most investors are ignoring the fairly average growth expectations and are willing to pay up for exposure to the stock. Although, additional gains will be difficult to achieve as this level of earnings growth is likely to weigh down the share price eventually.
What We Can Learn From Intercontinental Exchange's P/E?
We'd say the price-to-earnings ratio's power isn't primarily as a valuation instrument but rather to gauge current investor sentiment and future expectations.
We've established that Intercontinental Exchange currently trades on a higher than expected P/E since its forecast growth is only in line with the wider market. When we see an average earnings outlook with market-like growth, we suspect the share price is at risk of declining, sending the high P/E lower. Unless these conditions improve, it's challenging to accept these prices as being reasonable.
Plus, you should also learn about these 2 warning signs we've spotted with Intercontinental Exchange (including 1 which can't be ignored).
If you're unsure about the strength of Intercontinental Exchange's business, why not explore our interactive list of stocks with solid business fundamentals for some other companies you may have missed.
Have feedback on this article? Concerned about the content? Get in touch with us directly. Alternatively, email editorial-team (at) simplywallst.com.
This article by Simply Wall St is general in nature. We provide commentary based on historical data and analyst forecasts only using an unbiased methodology and our articles are not intended to be financial advice. It does not constitute a recommendation to buy or sell any stock, and does not take account of your objectives, or your financial situation. We aim to bring you long-term focused analysis driven by fundamental data. Note that our analysis may not factor in the latest price-sensitive company announcements or qualitative material. Simply Wall St has no position in any stocks mentioned.
Join A Paid User Research Session
You’ll receive a US$30 Amazon Gift card for 1 hour of your time while helping us build better investing tools for the individual investors like yourself. Sign up here
