
 Yahoo Finance
 Is Pinnacle Renewable Holdings Inc’s (TSE:PL) Balance Sheet A Threat To Its Future?

Investors are always looking for growth in small-cap stocks like Pinnacle Renewable Holdings Inc (TSE:PL), with a market cap of CA$536.4m. However, an important fact which most ignore is: how financially healthy is the business? Oil and Gas companies, especially ones that are currently loss-making, are inclined towards being higher risk. So, understanding the company’s financial health becomes vital. Here are a few basic checks that are good enough to have a broad overview of the company’s financial strength. Nevertheless, I know these factors are very high-level, so I suggest you dig deeper yourself into PL here.
Does PL produce enough cash relative to debt?
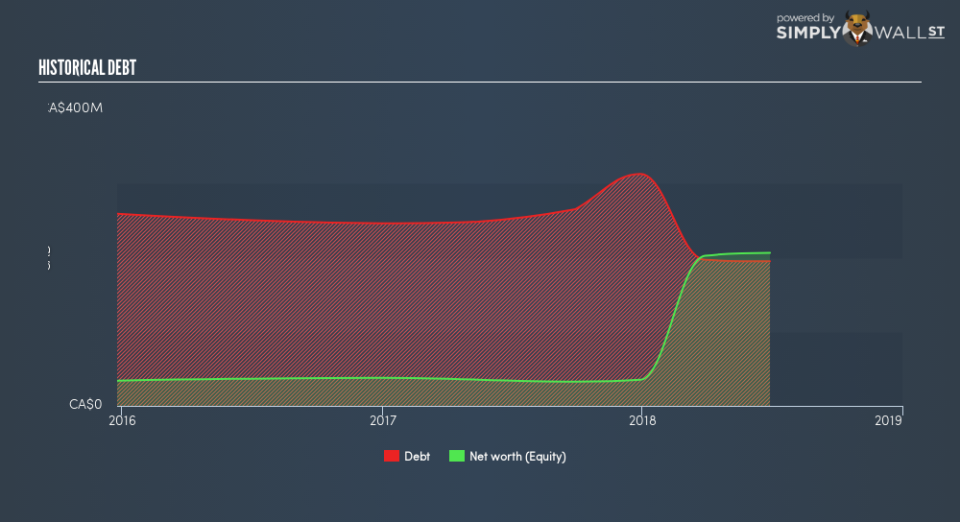
Over the past year, PL has reduced its debt from CA$265.5m to CA$195.1m , which comprises of short- and long-term debt. With this reduction in debt, the current cash and short-term investment levels stands at CA$22.3m , ready to deploy into the business. Moreover, PL has produced CA$44.5m in operating cash flow over the same time period, resulting in an operating cash to total debt ratio of 22.8%, signalling that PL’s current level of operating cash is high enough to cover debt. This ratio can also be interpreted as a measure of efficiency for loss making companies as traditional metrics such as return on asset (ROA) requires a positive net income. In PL’s case, it is able to generate 0.23x cash from its debt capital.
Does PL’s liquid assets cover its short-term commitments?
Looking at PL’s most recent CA$54.0m liabilities, it appears that the company has maintained a safe level of current assets to meet its obligations, with the current ratio last standing at 1.25x. Generally, for Oil and Gas companies, this is a reasonable ratio since there’s sufficient cash cushion without leaving too much capital idle or in low-earning investments.
Does PL face the risk of succumbing to its debt-load?
With debt reaching 94.5% of equity, PL may be thought of as relatively highly levered. This is not uncommon for a small-cap company given that debt tends to be lower-cost and at times, more accessible. However, since PL is currently loss-making, sustainability of its current state of operations becomes a concern. Maintaining a high level of debt, while revenues are still below costs, can be dangerous as liquidity tends to dry up in unexpected downturns.
Next Steps:
At its current level of cash flow coverage, PL has room for improvement to better cushion for events which may require debt repayment. Though, the company exhibits proper management of current assets and upcoming liabilities. I admit this is a fairly basic analysis for PL’s financial health. Other important fundamentals need to be considered alongside. I recommend you continue to research Pinnacle Renewable Holdings to get a more holistic view of the stock by looking at:
Future Outlook: What are well-informed industry analysts predicting for PL’s future growth? Take a look at our free research report of analyst consensus for PL’s outlook.
Historical Performance: What has PL’s returns been like over the past? Go into more detail in the past track record analysis and take a look at the free visual representations of our analysis for more clarity.
Other High-Performing Stocks: Are there other stocks that provide better prospects with proven track records? Explore our free list of these great stocks here.
To help readers see past the short term volatility of the financial market, we aim to bring you a long-term focused research analysis purely driven by fundamental data. Note that our analysis does not factor in the latest price-sensitive company announcements.
The author is an independent contributor and at the time of publication had no position in the stocks mentioned. For errors that warrant correction please contact the editor at editorial-team@simplywallst.com.
