
 Yahoo Finance
 Pine Cliff Energy (TSE:PNE) Could Become A Multi-Bagger
If we want to find a potential multi-bagger, often there are underlying trends that can provide clues. Typically, we'll want to notice a trend of growing return on capital employed (ROCE) and alongside that, an expanding base of capital employed. Ultimately, this demonstrates that it's a business that is reinvesting profits at increasing rates of return. So when we looked at the ROCE trend of Pine Cliff Energy (TSE:PNE) we really liked what we saw.
Return On Capital Employed (ROCE): What Is It?
For those that aren't sure what ROCE is, it measures the amount of pre-tax profits a company can generate from the capital employed in its business. To calculate this metric for Pine Cliff Energy, this is the formula:
Return on Capital Employed = Earnings Before Interest and Tax (EBIT) ÷ (Total Assets - Current Liabilities)
0.26 = CA$82m ÷ (CA$361m - CA$40m) (Based on the trailing twelve months to June 2022).
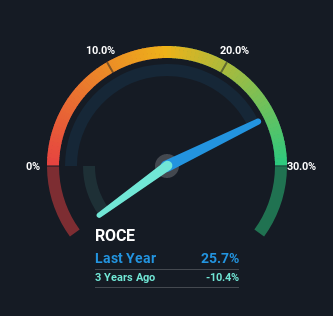
Thus, Pine Cliff Energy has an ROCE of 26%. That's a fantastic return and not only that, it outpaces the average of 19% earned by companies in a similar industry.
View our latest analysis for Pine Cliff Energy
While the past is not representative of the future, it can be helpful to know how a company has performed historically, which is why we have this chart above. If you're interested in investigating Pine Cliff Energy's past further, check out this free graph of past earnings, revenue and cash flow.
What The Trend Of ROCE Can Tell Us
We're delighted to see that Pine Cliff Energy is reaping rewards from its investments and has now broken into profitability. Historically the company was generating losses but as we can see from the latest figures referenced above, they're now earning 26% on their capital employed. At first glance, it seems the business is getting more proficient at generating returns, because over the same period, the amount of capital employed has reduced by 28%. This could potentially mean that the company is selling some of its assets.
In Conclusion...
In the end, Pine Cliff Energy has proven it's capital allocation skills are good with those higher returns from less amount of capital. Since the stock has returned a staggering 242% to shareholders over the last five years, it looks like investors are recognizing these changes. So given the stock has proven it has promising trends, it's worth researching the company further to see if these trends are likely to persist.
On a final note, we've found 4 warning signs for Pine Cliff Energy that we think you should be aware of.
High returns are a key ingredient to strong performance, so check out our free list ofstocks earning high returns on equity with solid balance sheets.
Have feedback on this article? Concerned about the content? Get in touch with us directly. Alternatively, email editorial-team (at) simplywallst.com.
This article by Simply Wall St is general in nature. We provide commentary based on historical data and analyst forecasts only using an unbiased methodology and our articles are not intended to be financial advice. It does not constitute a recommendation to buy or sell any stock, and does not take account of your objectives, or your financial situation. We aim to bring you long-term focused analysis driven by fundamental data. Note that our analysis may not factor in the latest price-sensitive company announcements or qualitative material. Simply Wall St has no position in any stocks mentioned.
Join A Paid User Research Session
You’ll receive a US$30 Amazon Gift card for 1 hour of your time while helping us build better investing tools for the individual investors like yourself. Sign up here
