
 Yahoo Finance
 A Piece Of The Puzzle Missing From Block, Inc.'s (NYSE:SQ) Share Price
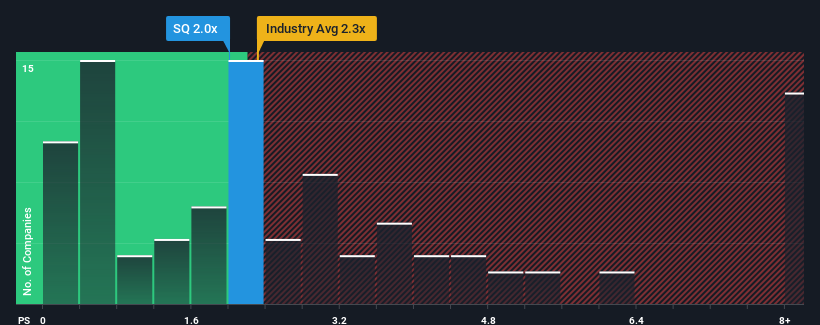
There wouldn't be many who think Block, Inc.'s (NYSE:SQ) price-to-sales (or "P/S") ratio of 2x is worth a mention when the median P/S for the Diversified Financial industry in the United States is similar at about 2.3x. Although, it's not wise to simply ignore the P/S without explanation as investors may be disregarding a distinct opportunity or a costly mistake.
View our latest analysis for Block
What Does Block's P/S Mean For Shareholders?
With revenue growth that's inferior to most other companies of late, Block has been relatively sluggish. It might be that many expect the uninspiring revenue performance to strengthen positively, which has kept the P/S ratio from falling. You'd really hope so, otherwise you're paying a relatively elevated price for a company with this sort of growth profile.
Keen to find out how analysts think Block's future stacks up against the industry? In that case, our free report is a great place to start.
Do Revenue Forecasts Match The P/S Ratio?
There's an inherent assumption that a company should be matching the industry for P/S ratios like Block's to be considered reasonable.
Retrospectively, the last year delivered a decent 12% gain to the company's revenues. Pleasingly, revenue has also lifted 261% in aggregate from three years ago, partly thanks to the last 12 months of growth. Therefore, it's fair to say the revenue growth recently has been superb for the company.
Looking ahead now, revenue is anticipated to climb by 15% each year during the coming three years according to the analysts following the company. That's shaping up to be materially higher than the 11% per annum growth forecast for the broader industry.
With this in consideration, we find it intriguing that Block's P/S is closely matching its industry peers. It may be that most investors aren't convinced the company can achieve future growth expectations.
What Does Block's P/S Mean For Investors?
We'd say the price-to-sales ratio's power isn't primarily as a valuation instrument but rather to gauge current investor sentiment and future expectations.
Despite enticing revenue growth figures that outpace the industry, Block's P/S isn't quite what we'd expect. Perhaps uncertainty in the revenue forecasts are what's keeping the P/S ratio consistent with the rest of the industry. At least the risk of a price drop looks to be subdued, but investors seem to think future revenue could see some volatility.
You always need to take note of risks, for example - Block has 2 warning signs we think you should be aware of.
Of course, profitable companies with a history of great earnings growth are generally safer bets. So you may wish to see this free collection of other companies that have reasonable P/E ratios and have grown earnings strongly.
Have feedback on this article? Concerned about the content? Get in touch with us directly. Alternatively, email editorial-team (at) simplywallst.com.
This article by Simply Wall St is general in nature. We provide commentary based on historical data and analyst forecasts only using an unbiased methodology and our articles are not intended to be financial advice. It does not constitute a recommendation to buy or sell any stock, and does not take account of your objectives, or your financial situation. We aim to bring you long-term focused analysis driven by fundamental data. Note that our analysis may not factor in the latest price-sensitive company announcements or qualitative material. Simply Wall St has no position in any stocks mentioned.
Join A Paid User Research Session
You’ll receive a US$30 Amazon Gift card for 1 hour of your time while helping us build better investing tools for the individual investors like yourself. Sign up here
