
 Yahoo Finance
 Philip Morris International (NYSE:PM) Is Reinvesting To Multiply In Value
If you're looking for a multi-bagger, there's a few things to keep an eye out for. Ideally, a business will show two trends; firstly a growing return on capital employed (ROCE) and secondly, an increasing amount of capital employed. Basically this means that a company has profitable initiatives that it can continue to reinvest in, which is a trait of a compounding machine. With that in mind, the ROCE of Philip Morris International (NYSE:PM) looks attractive right now, so lets see what the trend of returns can tell us.
What Is Return On Capital Employed (ROCE)?
Just to clarify if you're unsure, ROCE is a metric for evaluating how much pre-tax income (in percentage terms) a company earns on the capital invested in its business. To calculate this metric for Philip Morris International, this is the formula:
Return on Capital Employed = Earnings Before Interest and Tax (EBIT) ÷ (Total Assets - Current Liabilities)
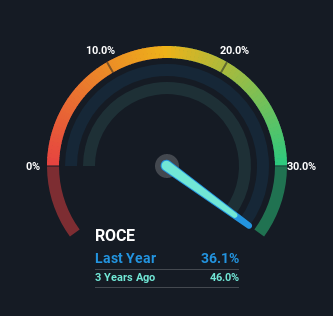
0.36 = US$12b ÷ (US$62b - US$27b) (Based on the trailing twelve months to December 2022).
So, Philip Morris International has an ROCE of 36%. That's a fantastic return and not only that, it outpaces the average of 8.5% earned by companies in a similar industry.
Check out our latest analysis for Philip Morris International
Above you can see how the current ROCE for Philip Morris International compares to its prior returns on capital, but there's only so much you can tell from the past. If you'd like to see what analysts are forecasting going forward, you should check out our free report for Philip Morris International.
The Trend Of ROCE
We'd be pretty happy with returns on capital like Philip Morris International. The company has consistently earned 36% for the last five years, and the capital employed within the business has risen 27% in that time. Returns like this are the envy of most businesses and given it has repeatedly reinvested at these rates, that's even better. You'll see this when looking at well operated businesses or favorable business models.
On a separate but related note, it's important to know that Philip Morris International has a current liabilities to total assets ratio of 44%, which we'd consider pretty high. This can bring about some risks because the company is basically operating with a rather large reliance on its suppliers or other sorts of short-term creditors. While it's not necessarily a bad thing, it can be beneficial if this ratio is lower.
Our Take On Philip Morris International's ROCE
In short, we'd argue Philip Morris International has the makings of a multi-bagger since its been able to compound its capital at very profitable rates of return. And given the stock has only risen 27% over the last five years, we'd suspect the market is beginning to recognize these trends. So because of the trends we're seeing, we'd recommend looking further into this stock to see if it has the makings of a multi-bagger.
If you want to continue researching Philip Morris International, you might be interested to know about the 2 warning signs that our analysis has discovered.
If you'd like to see other companies earning high returns, check out our free list of companies earning high returns with solid balance sheets here.
Have feedback on this article? Concerned about the content? Get in touch with us directly. Alternatively, email editorial-team (at) simplywallst.com.
This article by Simply Wall St is general in nature. We provide commentary based on historical data and analyst forecasts only using an unbiased methodology and our articles are not intended to be financial advice. It does not constitute a recommendation to buy or sell any stock, and does not take account of your objectives, or your financial situation. We aim to bring you long-term focused analysis driven by fundamental data. Note that our analysis may not factor in the latest price-sensitive company announcements or qualitative material. Simply Wall St has no position in any stocks mentioned.
Join A Paid User Research Session
You’ll receive a US$30 Amazon Gift card for 1 hour of your time while helping us build better investing tools for the individual investors like yourself. Sign up here
