
 Yahoo Finance
 Peyto Exploration & Development (TSE:PEY) Is Looking To Continue Growing Its Returns On Capital
If we want to find a potential multi-bagger, often there are underlying trends that can provide clues. One common approach is to try and find a company with returns on capital employed (ROCE) that are increasing, in conjunction with a growing amount of capital employed. Basically this means that a company has profitable initiatives that it can continue to reinvest in, which is a trait of a compounding machine. So on that note, Peyto Exploration & Development (TSE:PEY) looks quite promising in regards to its trends of return on capital.
Return On Capital Employed (ROCE): What Is It?
If you haven't worked with ROCE before, it measures the 'return' (pre-tax profit) a company generates from capital employed in its business. The formula for this calculation on Peyto Exploration & Development is:
Return on Capital Employed = Earnings Before Interest and Tax (EBIT) ÷ (Total Assets - Current Liabilities)
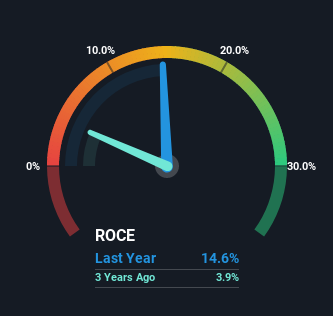
0.15 = CA$501m ÷ (CA$3.9b - CA$507m) (Based on the trailing twelve months to September 2022).
So, Peyto Exploration & Development has an ROCE of 15%. In isolation, that's a pretty standard return but against the Oil and Gas industry average of 21%, it's not as good.
Check out our latest analysis for Peyto Exploration & Development
In the above chart we have measured Peyto Exploration & Development's prior ROCE against its prior performance, but the future is arguably more important. If you're interested, you can view the analysts predictions in our free report on analyst forecasts for the company.
The Trend Of ROCE
Peyto Exploration & Development's ROCE growth is quite impressive. Looking at the data, we can see that even though capital employed in the business has remained relatively flat, the ROCE generated has risen by 89% over the last five years. So it's likely that the business is now reaping the full benefits of its past investments, since the capital employed hasn't changed considerably. It's worth looking deeper into this though because while it's great that the business is more efficient, it might also mean that going forward the areas to invest internally for the organic growth are lacking.
What We Can Learn From Peyto Exploration & Development's ROCE
In summary, we're delighted to see that Peyto Exploration & Development has been able to increase efficiencies and earn higher rates of return on the same amount of capital. Considering the stock has delivered 12% to its stockholders over the last five years, it may be fair to think that investors aren't fully aware of the promising trends yet. Given that, we'd look further into this stock in case it has more traits that could make it multiply in the long term.
If you'd like to know about the risks facing Peyto Exploration & Development, we've discovered 3 warning signs that you should be aware of.
While Peyto Exploration & Development isn't earning the highest return, check out this free list of companies that are earning high returns on equity with solid balance sheets.
Have feedback on this article? Concerned about the content? Get in touch with us directly. Alternatively, email editorial-team (at) simplywallst.com.
This article by Simply Wall St is general in nature. We provide commentary based on historical data and analyst forecasts only using an unbiased methodology and our articles are not intended to be financial advice. It does not constitute a recommendation to buy or sell any stock, and does not take account of your objectives, or your financial situation. We aim to bring you long-term focused analysis driven by fundamental data. Note that our analysis may not factor in the latest price-sensitive company announcements or qualitative material. Simply Wall St has no position in any stocks mentioned.
Join A Paid User Research Session
You’ll receive a US$30 Amazon Gift card for 1 hour of your time while helping us build better investing tools for the individual investors like yourself. Sign up here
