
 Yahoo Finance
 Are Peyto Exploration & Development Corp’s (TSE:PEY) Interest Costs Too High?

While small-cap stocks, such as Peyto Exploration & Development Corp (TSE:PEY) with its market cap of CA$1.78b, are popular for their explosive growth, investors should also be aware of their balance sheet to judge whether the company can survive a downturn. Companies operating in the Oil and Gas industry, even ones that are profitable, tend to be high risk. Assessing first and foremost the financial health is vital. Here are a few basic checks that are good enough to have a broad overview of the company’s financial strength. Nevertheless, given that I have not delve into the company-specifics, I recommend you dig deeper yourself into PEY here.
How does PEY’s operating cash flow stack up against its debt?
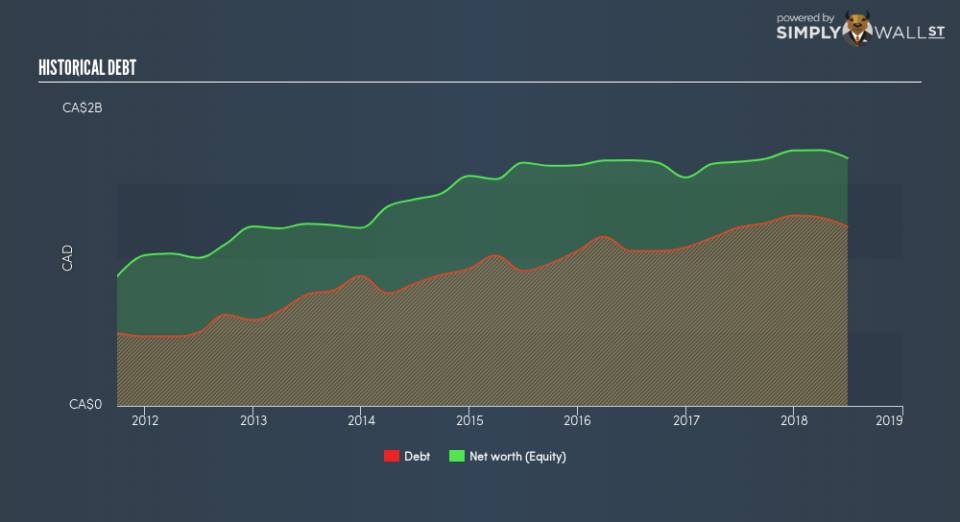
PEY’s debt level has been constant at around CA$1.21b over the previous year made up of current and long term debt. At this constant level of debt, PEY’s cash and short-term investments stands at CA$1.1m for investing into the business. Additionally, PEY has generated cash from operations of CA$547.1m during the same period of time, resulting in an operating cash to total debt ratio of 45.2%, meaning that PEY’s debt is appropriately covered by operating cash. This ratio can also be a sign of operational efficiency as an alternative to return on assets. In PEY’s case, it is able to generate 0.45x cash from its debt capital.
Does PEY’s liquid assets cover its short-term commitments?
At the current liabilities level of CA$162.5m liabilities, it seems that the business is not able to meet these obligations given the level of current assets of CA$133.1m, with a current ratio of 0.82x below the prudent level of 3x.
Is PEY’s debt level acceptable?
PEY is a relatively highly levered company with a debt-to-equity of 72.4%. This is not uncommon for a small-cap company given that debt tends to be lower-cost and at times, more accessible. We can check to see whether PEY is able to meet its debt obligations by looking at the net interest coverage ratio. A company generating earnings before interest and tax (EBIT) at least three times its net interest payments is considered financially sound. In PEY’s, case, the ratio of 5.66x suggests that interest is appropriately covered, which means that lenders may be less hesitant to lend out more funding as PEY’s high interest coverage is seen as responsible and safe practice.
Next Steps:
Although PEY’s debt level is towards the higher end of the spectrum, its cash flow coverage seems adequate to meet debt obligations which means its debt is being efficiently utilised. Though its lack of liquidity raises questions over current asset management practices for the small-cap. This is only a rough assessment of financial health, and I’m sure PEY has company-specific issues impacting its capital structure decisions. You should continue to research Peyto Exploration & Development to get a more holistic view of the stock by looking at:
Future Outlook: What are well-informed industry analysts predicting for PEY’s future growth? Take a look at our free research report of analyst consensus for PEY’s outlook.
Valuation: What is PEY worth today? Is the stock undervalued, even when its growth outlook is factored into its intrinsic value? The intrinsic value infographic in our free research report helps visualize whether PEY is currently mispriced by the market.
Other High-Performing Stocks: Are there other stocks that provide better prospects with proven track records? Explore our free list of these great stocks here.
To help readers see past the short term volatility of the financial market, we aim to bring you a long-term focused research analysis purely driven by fundamental data. Note that our analysis does not factor in the latest price-sensitive company announcements.
The author is an independent contributor and at the time of publication had no position in the stocks mentioned. For errors that warrant correction please contact the editor at editorial-team@simplywallst.com.
