
 Yahoo Finance
 You're probably using P/E ratios incorrectly
The most popular way to measure value in the stock market is to take the price and divide it by earnings. This is the price/earnings (P/E) ratio. When the P/E ratio is above average, stocks are arguably expensive. When it’s below average, stocks are arguably cheap.
Currently, the PE ratio for the S&P 500 (^GSPC) is well above its long term averages, which has some analysts telling clients that you have to go back to the dotcom bubble to see a more expensive market.
“The current trailing 12-month P/E ratio of 19.4 is above the three most recent historical averages: 5-year (15.8), 10- year (15.9), and 15-year (17.6),” FactSet’s John Butters observed. “Back on December 31, the trailing 12-month P/E ratio was 17.9. Since this date, the price of the S&P 500 has increased by 5.9% (to 2163.75 from 2043.94), while the trailing 12-month EPS estimate has decreased by 2.5% (to $111.36 from $114.19). Thus, both the increase in the ‘P’ and the decrease in the ‘E’ have driven the increase in the trailing 12-month P/E ratio to 19.4 today from 17.9 at the start of the year.”
So is the market’s P/E signaling trouble?
The P/E alone doesn’t say much.
RBA’s Richard Bernstein has been writing a lot about P/E ratios and about how they currently do not contradict the bullish case for stocks.
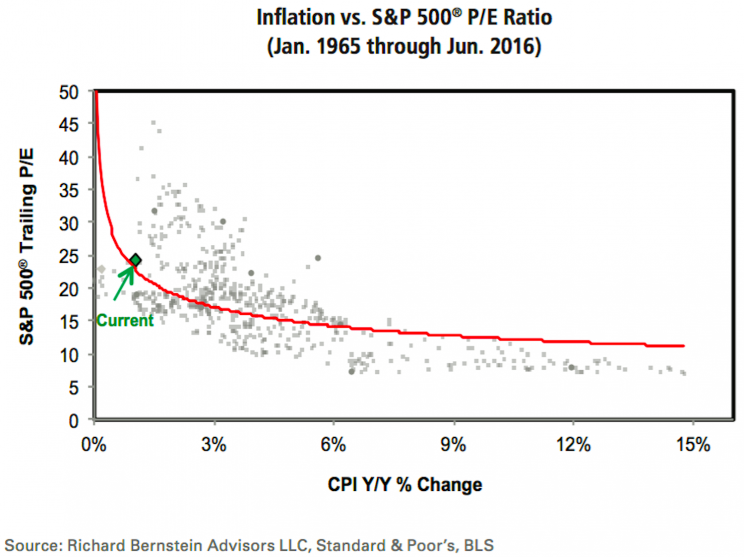
“PE ratios in isolation have not historically been good forecasters of future returns because PEs must be related to interest rates and inflation,” Bernstein said in a research note on Wednesday. And as everyone knows, interest rates are historically low and inflation is almost nonexistent.
This isn’t exactly an earth-shattering discovery. Other analysts will argue the same thing.
“There is little statistical evidence that the P/E ratio returns to an average value,” Wells Fargo’s John Silvia wrote in March. “The long cycles we see in the P/E ratio are driven by economic factors. During the 1970s, the upswing of inflation and interest rates, along with the uncertainty of oil shocks and recessions, surprised equity markets and led to a downshift in the P/E ratio. In contrast, the steady decline of both interest rates and inflation in the 1980s led to an increase in P/E ratios.”
Indeed, investment analysis is not simple, and it certainly is a mistake to consider P/E ratios in a vacuum. That’s not to say there isn’t another shortcut that helps investors interpret the signals sent by prices relative to earnings.
“There is an old investment rule-of-thumb called the Rule of 20 that uses combinations of headline inflation and the S&P 500 P/E to determine fair value,” Bernstein said. “Our valuation models are, of course, more elaborate than the simple Rule of 20, but based on a more rigorous analysis of inflation and P/E ratios, the current equity market appears, at worse, to be fairly valued. Investors forget that inflation was increasing leading up to the 2008 bear market. In fact, the CPI, which is a lagging indicator, peaked at 5.6% in July 2008. Today’s headline inflation is 1.0%.”
To reiterate, investing is complicated. But to be clear, while there are a lot of things to factor when discussing prices and valuations in the near-term, earnings and expectations for earnings growth will continue to be the most important drivers of stock prices.
“Yes, stock prices tend to follow earnings over longer periods of time, but for shorter horizons (one year), the picture is more complicated,” BMO’s Brian Belski said.
–
Sam Ro is managing editor at Yahoo Finance.
Read more:
Stocks today are reminiscent of 2 of history’s most exciting buying opportunities – RBC
The most important question in the stock market right now
The dumbest math mistake investors make in the stock market
Gutsy Wall Street analyst dares to debunk a sacred truism about the stock market
