
 Yahoo Finance
 The past year for Brooks Macdonald Group (LON:BRK) investors has not been profitable
Investors can approximate the average market return by buying an index fund. While individual stocks can be big winners, plenty more fail to generate satisfactory returns. For example, the Brooks Macdonald Group plc (LON:BRK) share price is down 23% in the last year. That contrasts poorly with the market decline of 1.6%. At least the damage isn't so bad if you look at the last three years, since the stock is down 1.7% in that time.
It's worthwhile assessing if the company's economics have been moving in lockstep with these underwhelming shareholder returns, or if there is some disparity between the two. So let's do just that.
See our latest analysis for Brooks Macdonald Group
While markets are a powerful pricing mechanism, share prices reflect investor sentiment, not just underlying business performance. One imperfect but simple way to consider how the market perception of a company has shifted is to compare the change in the earnings per share (EPS) with the share price movement.
During the unfortunate twelve months during which the Brooks Macdonald Group share price fell, it actually saw its earnings per share (EPS) improve by 19%. It's quite possible that growth expectations may have been unreasonable in the past.
It's surprising to see the share price fall so much, despite the improved EPS. But we might find some different metrics explain the share price movements better.
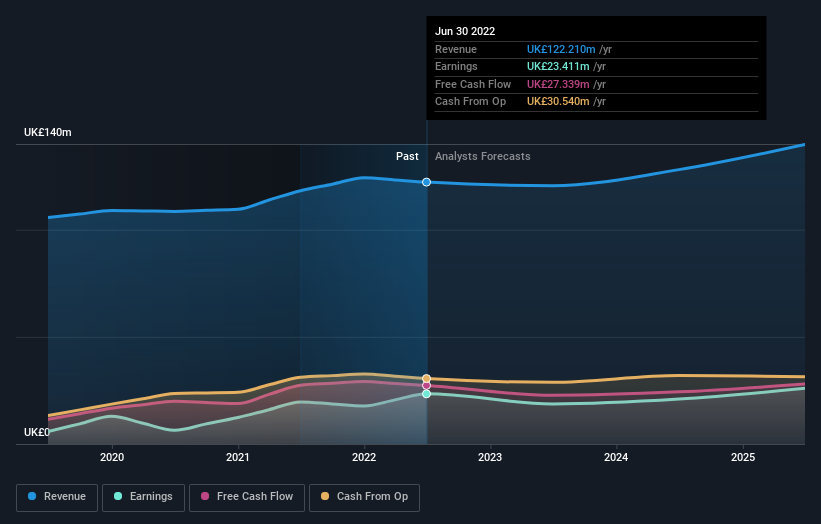
Brooks Macdonald Group managed to grow revenue over the last year, which is usually a real positive. Since we can't easily explain the share price movement based on these metrics, it might be worth considering how market sentiment has changed towards the stock.
You can see below how earnings and revenue have changed over time (discover the exact values by clicking on the image).
It's good to see that there was some significant insider buying in the last three months. That's a positive. On the other hand, we think the revenue and earnings trends are much more meaningful measures of the business. You can see what analysts are predicting for Brooks Macdonald Group in this interactive graph of future profit estimates.
What About Dividends?
It is important to consider the total shareholder return, as well as the share price return, for any given stock. Whereas the share price return only reflects the change in the share price, the TSR includes the value of dividends (assuming they were reinvested) and the benefit of any discounted capital raising or spin-off. Arguably, the TSR gives a more comprehensive picture of the return generated by a stock. We note that for Brooks Macdonald Group the TSR over the last 1 year was -20%, which is better than the share price return mentioned above. And there's no prize for guessing that the dividend payments largely explain the divergence!
A Different Perspective
While the broader market lost about 1.6% in the twelve months, Brooks Macdonald Group shareholders did even worse, losing 20% (even including dividends). However, it could simply be that the share price has been impacted by broader market jitters. It might be worth keeping an eye on the fundamentals, in case there's a good opportunity. On the bright side, long term shareholders have made money, with a gain of 4% per year over half a decade. It could be that the recent sell-off is an opportunity, so it may be worth checking the fundamental data for signs of a long term growth trend. I find it very interesting to look at share price over the long term as a proxy for business performance. But to truly gain insight, we need to consider other information, too. Take risks, for example - Brooks Macdonald Group has 1 warning sign we think you should be aware of.
Brooks Macdonald Group is not the only stock insiders are buying. So take a peek at this free list of growing companies with insider buying.
Please note, the market returns quoted in this article reflect the market weighted average returns of stocks that currently trade on GB exchanges.
Have feedback on this article? Concerned about the content? Get in touch with us directly. Alternatively, email editorial-team (at) simplywallst.com.
This article by Simply Wall St is general in nature. We provide commentary based on historical data and analyst forecasts only using an unbiased methodology and our articles are not intended to be financial advice. It does not constitute a recommendation to buy or sell any stock, and does not take account of your objectives, or your financial situation. We aim to bring you long-term focused analysis driven by fundamental data. Note that our analysis may not factor in the latest price-sensitive company announcements or qualitative material. Simply Wall St has no position in any stocks mentioned.
Join A Paid User Research Session
You’ll receive a US$30 Amazon Gift card for 1 hour of your time while helping us build better investing tools for the individual investors like yourself. Sign up here
