
 Yahoo Finance
 Is Parex Resources Inc.'s (TSE:PXT) Recent Stock Performance Influenced By Its Fundamentals In Any Way?
Most readers would already be aware that Parex Resources' (TSE:PXT) stock increased significantly by 24% over the past three months. We wonder if and what role the company's financials play in that price change as a company's long-term fundamentals usually dictate market outcomes. In this article, we decided to focus on Parex Resources' ROE.
Return on equity or ROE is a key measure used to assess how efficiently a company's management is utilizing the company's capital. In short, ROE shows the profit each dollar generates with respect to its shareholder investments.
See our latest analysis for Parex Resources
How Do You Calculate Return On Equity?
Return on equity can be calculated by using the formula:
Return on Equity = Net Profit (from continuing operations) ÷ Shareholders' Equity
So, based on the above formula, the ROE for Parex Resources is:
7.4% = US$99m ÷ US$1.3b (Based on the trailing twelve months to December 2020).
The 'return' is the yearly profit. So, this means that for every CA$1 of its shareholder's investments, the company generates a profit of CA$0.07.
What Has ROE Got To Do With Earnings Growth?
Thus far, we have learned that ROE measures how efficiently a company is generating its profits. Based on how much of its profits the company chooses to reinvest or "retain", we are then able to evaluate a company's future ability to generate profits. Generally speaking, other things being equal, firms with a high return on equity and profit retention, have a higher growth rate than firms that don’t share these attributes.
A Side By Side comparison of Parex Resources' Earnings Growth And 7.4% ROE
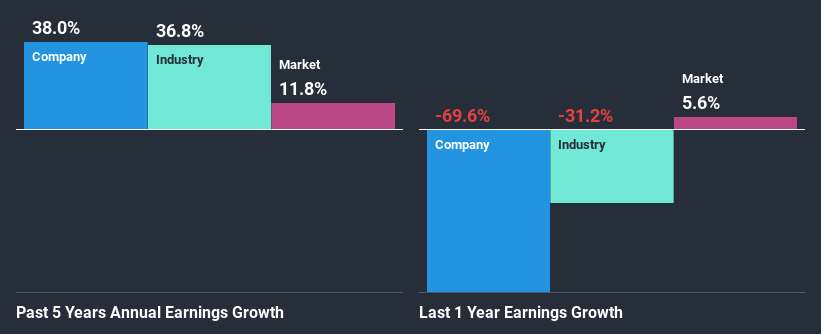
When you first look at it, Parex Resources' ROE doesn't look that attractive. However, its ROE is similar to the industry average of 8.0%, so we won't completely dismiss the company. Particularly, the exceptional 38% net income growth seen by Parex Resources over the past five years is pretty remarkable. Given the slightly low ROE, it is likely that there could be some other aspects that are driving this growth. For example, it is possible that the company's management has made some good strategic decisions, or that the company has a low payout ratio.
As a next step, we compared Parex Resources' net income growth with the industry and found that the company has a similar growth figure when compared with the industry average growth rate of 37% in the same period.
The basis for attaching value to a company is, to a great extent, tied to its earnings growth. What investors need to determine next is if the expected earnings growth, or the lack of it, is already built into the share price. Doing so will help them establish if the stock's future looks promising or ominous. If you're wondering about Parex Resources''s valuation, check out this gauge of its price-to-earnings ratio, as compared to its industry.
Is Parex Resources Efficiently Re-investing Its Profits?
Summary
In total, it does look like Parex Resources has some positive aspects to its business. Despite its low rate of return, the fact that the company reinvests a very high portion of its profits into its business, no doubt contributed to its high earnings growth. While we won't completely dismiss the company, what we would do, is try to ascertain how risky the business is to make a more informed decision around the company. You can see the 2 risks we have identified for Parex Resources by visiting our risks dashboard for free on our platform here.
This article by Simply Wall St is general in nature. It does not constitute a recommendation to buy or sell any stock, and does not take account of your objectives, or your financial situation. We aim to bring you long-term focused analysis driven by fundamental data. Note that our analysis may not factor in the latest price-sensitive company announcements or qualitative material. Simply Wall St has no position in any stocks mentioned.
Have feedback on this article? Concerned about the content? Get in touch with us directly. Alternatively, email editorial-team (at) simplywallst.com.
