
 Yahoo Finance
 Is Parex Resources Inc.'s (TSE:PXT) Recent Stock Performance Tethered To Its Strong Fundamentals?
Parex Resources (TSE:PXT) has had a great run on the share market with its stock up by a significant 22% over the last three months. Given that the market rewards strong financials in the long-term, we wonder if that is the case in this instance. Specifically, we decided to study Parex Resources' ROE in this article.
Return on Equity or ROE is a test of how effectively a company is growing its value and managing investors’ money. Simply put, it is used to assess the profitability of a company in relation to its equity capital.
View our latest analysis for Parex Resources
How Do You Calculate Return On Equity?
Return on equity can be calculated by using the formula:
Return on Equity = Net Profit (from continuing operations) ÷ Shareholders' Equity
So, based on the above formula, the ROE for Parex Resources is:
31% = US$457m ÷ US$1.5b (Based on the trailing twelve months to September 2022).
The 'return' is the amount earned after tax over the last twelve months. So, this means that for every CA$1 of its shareholder's investments, the company generates a profit of CA$0.31.
What Has ROE Got To Do With Earnings Growth?
We have already established that ROE serves as an efficient profit-generating gauge for a company's future earnings. Based on how much of its profits the company chooses to reinvest or "retain", we are then able to evaluate a company's future ability to generate profits. Generally speaking, other things being equal, firms with a high return on equity and profit retention, have a higher growth rate than firms that don’t share these attributes.
A Side By Side comparison of Parex Resources' Earnings Growth And 31% ROE
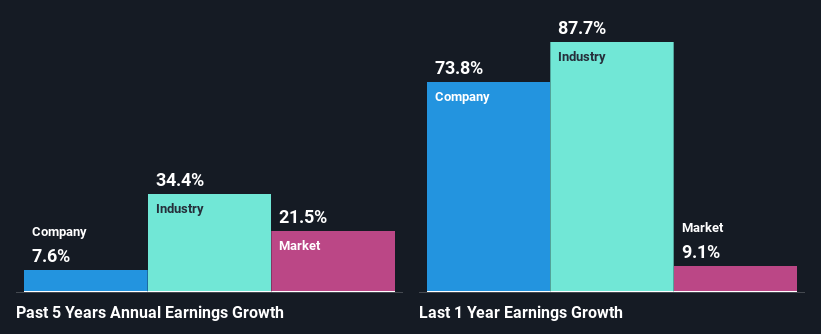
First thing first, we like that Parex Resources has an impressive ROE. Additionally, the company's ROE is higher compared to the industry average of 25% which is quite remarkable. This likely paved the way for the modest 7.6% net income growth seen by Parex Resources over the past five years. growth
We then compared Parex Resources' net income growth with the industry and found that the company's growth figure is lower than the average industry growth rate of 34% in the same period, which is a bit concerning.
Earnings growth is a huge factor in stock valuation. The investor should try to establish if the expected growth or decline in earnings, whichever the case may be, is priced in. Doing so will help them establish if the stock's future looks promising or ominous. One good indicator of expected earnings growth is the P/E ratio which determines the price the market is willing to pay for a stock based on its earnings prospects. So, you may want to check if Parex Resources is trading on a high P/E or a low P/E, relative to its industry.
Is Parex Resources Using Its Retained Earnings Effectively?
Parex Resources has a low three-year median payout ratio of 9.3%, meaning that the company retains the remaining 91% of its profits. This suggests that the management is reinvesting most of the profits to grow the business.
While Parex Resources has been growing its earnings, it only recently started to pay dividends which likely means that the company decided to impress new and existing shareholders with a dividend. Upon studying the latest analysts' consensus data, we found that the company's future payout ratio is expected to rise to 24% over the next three years. Accordingly, the expected increase in the payout ratio explains the expected decline in the company's ROE to 18%, over the same period.
Conclusion
On the whole, we feel that Parex Resources' performance has been quite good. In particular, it's great to see that the company is investing heavily into its business and along with a high rate of return, that has resulted in a respectable growth in its earnings. If the company continues to grow its earnings the way it has, that could have a positive impact on its share price given how earnings per share influence long-term share prices. Let's not forget, business risk is also one of the factors that affects the price of the stock. So this is also an important area that investors need to pay attention to before making a decision on any business. To know the 1 risk we have identified for Parex Resources visit our risks dashboard for free.
Have feedback on this article? Concerned about the content? Get in touch with us directly. Alternatively, email editorial-team (at) simplywallst.com.
This article by Simply Wall St is general in nature. We provide commentary based on historical data and analyst forecasts only using an unbiased methodology and our articles are not intended to be financial advice. It does not constitute a recommendation to buy or sell any stock, and does not take account of your objectives, or your financial situation. We aim to bring you long-term focused analysis driven by fundamental data. Note that our analysis may not factor in the latest price-sensitive company announcements or qualitative material. Simply Wall St has no position in any stocks mentioned.
Join A Paid User Research Session
You’ll receive a US$30 Amazon Gift card for 1 hour of your time while helping us build better investing tools for the individual investors like yourself. Sign up here
