
 Yahoo Finance
 What Is Palfinger's (VIE:PAL) P/E Ratio After Its Share Price Tanked?

To the annoyance of some shareholders, Palfinger (VIE:PAL) shares are down a considerable 33% in the last month. That drop has capped off a tough year for shareholders, with the share price down 32% in that time.
Assuming nothing else has changed, a lower share price makes a stock more attractive to potential buyers. In the long term, share prices tend to follow earnings per share, but in the short term prices bounce around in response to short term factors (which are not always obvious). So, on certain occasions, long term focussed investors try to take advantage of pessimistic expectations to buy shares at a better price. Perhaps the simplest way to get a read on investors' expectations of a business is to look at its Price to Earnings Ratio (PE Ratio). Investors have optimistic expectations of companies with higher P/E ratios, compared to companies with lower P/E ratios.
See our latest analysis for Palfinger
How Does Palfinger's P/E Ratio Compare To Its Peers?
We can tell from its P/E ratio of 8.53 that sentiment around Palfinger isn't particularly high. If you look at the image below, you can see Palfinger has a lower P/E than the average (13.5) in the machinery industry classification.
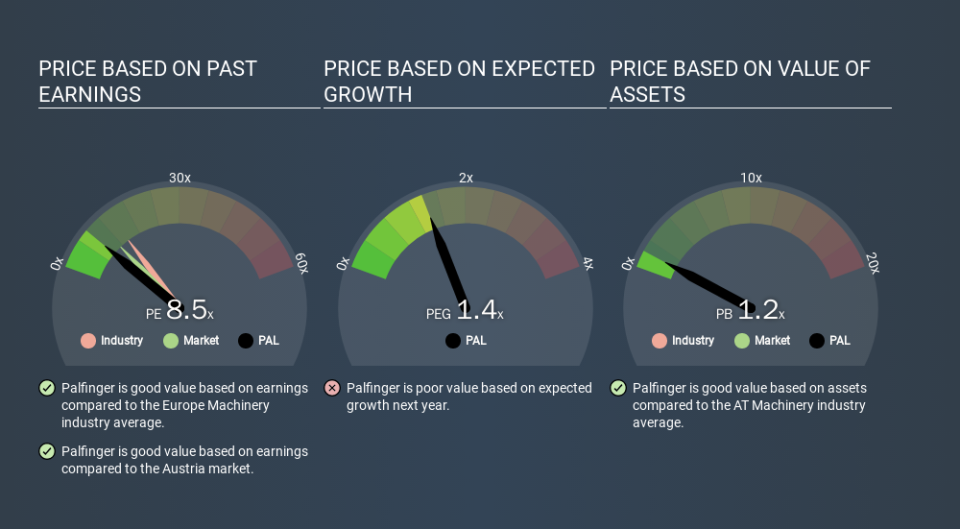
Its relatively low P/E ratio indicates that Palfinger shareholders think it will struggle to do as well as other companies in its industry classification. While current expectations are low, the stock could be undervalued if the situation is better than the market assumes. If you consider the stock interesting, further research is recommended. For example, I often monitor director buying and selling.
How Growth Rates Impact P/E Ratios
P/E ratios primarily reflect market expectations around earnings growth rates. Earnings growth means that in the future the 'E' will be higher. Therefore, even if you pay a high multiple of earnings now, that multiple will become lower in the future. A lower P/E should indicate the stock is cheap relative to others -- and that may attract buyers.
It's nice to see that Palfinger grew EPS by a stonking 38% in the last year. And earnings per share have improved by 15% annually, over the last five years. So we'd generally expect it to have a relatively high P/E ratio.
A Limitation: P/E Ratios Ignore Debt and Cash In The Bank
Don't forget that the P/E ratio considers market capitalization. That means it doesn't take debt or cash into account. Hypothetically, a company could reduce its future P/E ratio by spending its cash (or taking on debt) to achieve higher earnings.
While growth expenditure doesn't always pay off, the point is that it is a good option to have; but one that the P/E ratio ignores.
Palfinger's Balance Sheet
Palfinger has net debt worth 65% of its market capitalization. If you want to compare its P/E ratio to other companies, you should absolutely keep in mind it has significant borrowings.
The Bottom Line On Palfinger's P/E Ratio
Palfinger's P/E is 8.5 which is below average (10.2) in the AT market. The company has a meaningful amount of debt on the balance sheet, but that should not eclipse the solid earnings growth. The low P/E ratio suggests current market expectations are muted, implying these levels of growth will not continue. What can be absolutely certain is that the market has become more pessimistic about Palfinger over the last month, with the P/E ratio falling from 12.7 back then to 8.5 today. For those who prefer to invest with the flow of momentum, that might be a bad sign, but for deep value investors this stock might justify some research.
Investors should be looking to buy stocks that the market is wrong about. If it is underestimating a company, investors can make money by buying and holding the shares until the market corrects itself. So this free report on the analyst consensus forecasts could help you make a master move on this stock.
Of course you might be able to find a better stock than Palfinger. So you may wish to see this free collection of other companies that have grown earnings strongly.
If you spot an error that warrants correction, please contact the editor at editorial-team@simplywallst.com. This article by Simply Wall St is general in nature. It does not constitute a recommendation to buy or sell any stock, and does not take account of your objectives, or your financial situation. Simply Wall St has no position in the stocks mentioned.
We aim to bring you long-term focused research analysis driven by fundamental data. Note that our analysis may not factor in the latest price-sensitive company announcements or qualitative material. Thank you for reading.
