
 Yahoo Finance
 Outbrain Inc.'s (NASDAQ:OB) Low P/S No Reason For Excitement
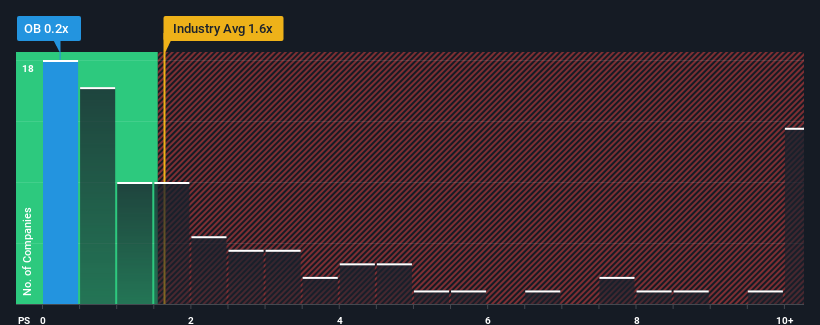
With a price-to-sales (or "P/S") ratio of 0.2x Outbrain Inc. (NASDAQ:OB) may be sending bullish signals at the moment, given that almost half of all the Interactive Media and Services companies in the United States have P/S ratios greater than 1.6x and even P/S higher than 4x are not unusual. However, the P/S might be low for a reason and it requires further investigation to determine if it's justified.
See our latest analysis for Outbrain
What Does Outbrain's P/S Mean For Shareholders?
Outbrain hasn't been tracking well recently as its declining revenue compares poorly to other companies, which have seen some growth in their revenues on average. Perhaps the P/S remains low as investors think the prospects of strong revenue growth aren't on the horizon. So while you could say the stock is cheap, investors will be looking for improvement before they see it as good value.
If you'd like to see what analysts are forecasting going forward, you should check out our free report on Outbrain.
Do Revenue Forecasts Match The Low P/S Ratio?
In order to justify its P/S ratio, Outbrain would need to produce sluggish growth that's trailing the industry.
Retrospectively, the last year delivered a frustrating 2.3% decrease to the company's top line. However, a few very strong years before that means that it was still able to grow revenue by an impressive 44% in total over the last three years. So we can start by confirming that the company has generally done a very good job of growing revenue over that time, even though it had some hiccups along the way.
Turning to the outlook, the next three years should generate growth of 6.4% each year as estimated by the five analysts watching the company. With the industry predicted to deliver 10% growth per year, the company is positioned for a weaker revenue result.
In light of this, it's understandable that Outbrain's P/S sits below the majority of other companies. It seems most investors are expecting to see limited future growth and are only willing to pay a reduced amount for the stock.
The Final Word
Using the price-to-sales ratio alone to determine if you should sell your stock isn't sensible, however it can be a practical guide to the company's future prospects.
As we suspected, our examination of Outbrain's analyst forecasts revealed that its inferior revenue outlook is contributing to its low P/S. At this stage investors feel the potential for an improvement in revenue isn't great enough to justify a higher P/S ratio. It's hard to see the share price rising strongly in the near future under these circumstances.
The company's balance sheet is another key area for risk analysis. You can assess many of the main risks through our free balance sheet analysis for Outbrain with six simple checks.
If these risks are making you reconsider your opinion on Outbrain, explore our interactive list of high quality stocks to get an idea of what else is out there.
Have feedback on this article? Concerned about the content? Get in touch with us directly. Alternatively, email editorial-team (at) simplywallst.com.
This article by Simply Wall St is general in nature. We provide commentary based on historical data and analyst forecasts only using an unbiased methodology and our articles are not intended to be financial advice. It does not constitute a recommendation to buy or sell any stock, and does not take account of your objectives, or your financial situation. We aim to bring you long-term focused analysis driven by fundamental data. Note that our analysis may not factor in the latest price-sensitive company announcements or qualitative material. Simply Wall St has no position in any stocks mentioned.
Join A Paid User Research Session
You’ll receive a US$30 Amazon Gift card for 1 hour of your time while helping us build better investing tools for the individual investors like yourself. Sign up here
