
 Yahoo Finance
 Is Orion Engineered Carbons S.A.'s (NYSE:OEC) ROE Of 22% Impressive?
Many investors are still learning about the various metrics that can be useful when analysing a stock. This article is for those who would like to learn about Return On Equity (ROE). To keep the lesson grounded in practicality, we'll use ROE to better understand Orion Engineered Carbons S.A. (NYSE:OEC).
Return on equity or ROE is a key measure used to assess how efficiently a company's management is utilizing the company's capital. In short, ROE shows the profit each dollar generates with respect to its shareholder investments.
View our latest analysis for Orion Engineered Carbons
How Do You Calculate Return On Equity?
ROE can be calculated by using the formula:
Return on Equity = Net Profit (from continuing operations) ÷ Shareholders' Equity
So, based on the above formula, the ROE for Orion Engineered Carbons is:
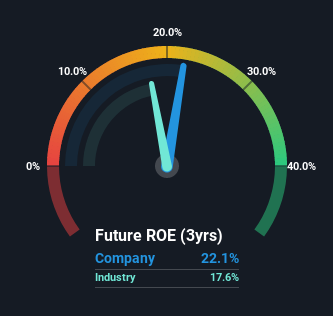
22% = US$95m ÷ US$431m (Based on the trailing twelve months to September 2022).
The 'return' is the yearly profit. That means that for every $1 worth of shareholders' equity, the company generated $0.22 in profit.
Does Orion Engineered Carbons Have A Good ROE?
By comparing a company's ROE with its industry average, we can get a quick measure of how good it is. However, this method is only useful as a rough check, because companies do differ quite a bit within the same industry classification. Pleasingly, Orion Engineered Carbons has a superior ROE than the average (18%) in the Chemicals industry.
That is a good sign. With that said, a high ROE doesn't always indicate high profitability. Aside from changes in net income, a high ROE can also be the outcome of high debt relative to equity, which indicates risk. Our risks dashboardshould have the 3 risks we have identified for Orion Engineered Carbons.
Why You Should Consider Debt When Looking At ROE
Virtually all companies need money to invest in the business, to grow profits. That cash can come from retained earnings, issuing new shares (equity), or debt. In the case of the first and second options, the ROE will reflect this use of cash, for growth. In the latter case, the debt required for growth will boost returns, but will not impact the shareholders' equity. Thus the use of debt can improve ROE, albeit along with extra risk in the case of stormy weather, metaphorically speaking.
Combining Orion Engineered Carbons' Debt And Its 22% Return On Equity
It's worth noting the high use of debt by Orion Engineered Carbons, leading to its debt to equity ratio of 2.04. While no doubt that its ROE is impressive, we would have been even more impressed had the company achieved this with lower debt. Debt does bring extra risk, so it's only really worthwhile when a company generates some decent returns from it.
Conclusion
Return on equity is a useful indicator of the ability of a business to generate profits and return them to shareholders. A company that can achieve a high return on equity without debt could be considered a high quality business. If two companies have the same ROE, then I would generally prefer the one with less debt.
But when a business is high quality, the market often bids it up to a price that reflects this. It is important to consider other factors, such as future profit growth -- and how much investment is required going forward. So you might want to take a peek at this data-rich interactive graph of forecasts for the company.
Of course, you might find a fantastic investment by looking elsewhere. So take a peek at this free list of interesting companies.
Have feedback on this article? Concerned about the content? Get in touch with us directly. Alternatively, email editorial-team (at) simplywallst.com.
This article by Simply Wall St is general in nature. We provide commentary based on historical data and analyst forecasts only using an unbiased methodology and our articles are not intended to be financial advice. It does not constitute a recommendation to buy or sell any stock, and does not take account of your objectives, or your financial situation. We aim to bring you long-term focused analysis driven by fundamental data. Note that our analysis may not factor in the latest price-sensitive company announcements or qualitative material. Simply Wall St has no position in any stocks mentioned.
Join A Paid User Research Session
You’ll receive a US$30 Amazon Gift card for 1 hour of your time while helping us build better investing tools for the individual investors like yourself. Sign up here
