
 Yahoo Finance
 Is New Oriental Education & Technology Group Inc.’s (NYSE:EDU) 12% ROCE Any Good?

Today we'll look at New Oriental Education & Technology Group Inc. (NYSE:EDU) and reflect on its potential as an investment. Specifically, we'll consider its Return On Capital Employed (ROCE), since that will give us an insight into how efficiently the business can generate profits from the capital it requires.
First, we'll go over how we calculate ROCE. Then we'll compare its ROCE to similar companies. Finally, we'll look at how its current liabilities affect its ROCE.
Understanding Return On Capital Employed (ROCE)
ROCE is a metric for evaluating how much pre-tax income (in percentage terms) a company earns on the capital invested in its business. In general, businesses with a higher ROCE are usually better quality. Ultimately, it is a useful but imperfect metric. Renowned investment researcher Michael Mauboussin has suggested that a high ROCE can indicate that 'one dollar invested in the company generates value of more than one dollar'.
So, How Do We Calculate ROCE?
Analysts use this formula to calculate return on capital employed:
Return on Capital Employed = Earnings Before Interest and Tax (EBIT) ÷ (Total Assets - Current Liabilities)
Or for New Oriental Education & Technology Group:
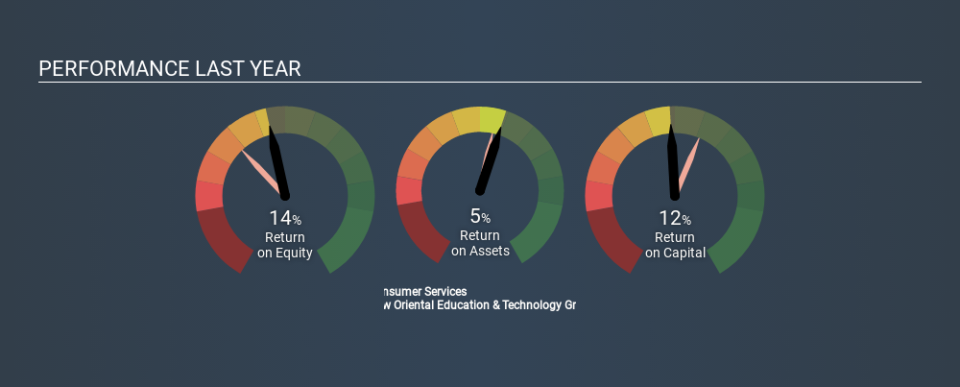
0.12 = US$444m ÷ (US$6.5b - US$2.7b) (Based on the trailing twelve months to November 2019.)
So, New Oriental Education & Technology Group has an ROCE of 12%.
View our latest analysis for New Oriental Education & Technology Group
Does New Oriental Education & Technology Group Have A Good ROCE?
One way to assess ROCE is to compare similar companies. Using our data, we find that New Oriental Education & Technology Group's ROCE is meaningfully better than the 8.1% average in the Consumer Services industry. We would consider this a positive, as it suggests it is using capital more effectively than other similar companies. Independently of how New Oriental Education & Technology Group compares to its industry, its ROCE in absolute terms appears decent, and the company may be worthy of closer investigation.
You can see in the image below how New Oriental Education & Technology Group's ROCE compares to its industry. Click to see more on past growth.
Remember that this metric is backwards looking - it shows what has happened in the past, and does not accurately predict the future. Companies in cyclical industries can be difficult to understand using ROCE, as returns typically look high during boom times, and low during busts. ROCE is only a point-in-time measure. Future performance is what matters, and you can see analyst predictions in our free report on analyst forecasts for the company.
What Are Current Liabilities, And How Do They Affect New Oriental Education & Technology Group's ROCE?
Current liabilities include invoices, such as supplier payments, short-term debt, or a tax bill, that need to be paid within 12 months. Due to the way the ROCE equation works, having large bills due in the near term can make it look as though a company has less capital employed, and thus a higher ROCE than usual. To counter this, investors can check if a company has high current liabilities relative to total assets.
New Oriental Education & Technology Group has current liabilities of US$2.7b and total assets of US$6.5b. As a result, its current liabilities are equal to approximately 41% of its total assets. With this level of current liabilities, New Oriental Education & Technology Group's ROCE is boosted somewhat.
The Bottom Line On New Oriental Education & Technology Group's ROCE
While its ROCE looks good, it's worth remembering that the current liabilities are making the business look better. New Oriental Education & Technology Group shapes up well under this analysis, but it is far from the only business delivering excellent numbers . You might also want to check this free collection of companies delivering excellent earnings growth.
If you are like me, then you will not want to miss this free list of growing companies that insiders are buying.
If you spot an error that warrants correction, please contact the editor at editorial-team@simplywallst.com. This article by Simply Wall St is general in nature. It does not constitute a recommendation to buy or sell any stock, and does not take account of your objectives, or your financial situation. Simply Wall St has no position in the stocks mentioned.
We aim to bring you long-term focused research analysis driven by fundamental data. Note that our analysis may not factor in the latest price-sensitive company announcements or qualitative material. Thank you for reading.
