
 Yahoo Finance
 One Thing To Remember About The Patrick Industries, Inc. (NASDAQ:PATK) Share Price

Anyone researching Patrick Industries, Inc. (NASDAQ:PATK) might want to consider the historical volatility of the share price. Modern finance theory considers volatility to be a measure of risk, and there are two main types of price volatility. The first type is company specific volatility. Investors use diversification across uncorrelated stocks to reduce this kind of price volatility across the portfolio. The second sort is caused by the natural volatility of markets, overall. For example, certain macroeconomic events will impact (virtually) all stocks on the market.
Some stocks see their prices move in concert with the market. Others tend towards stronger, gentler or unrelated price movements. Beta is a widely used metric to measure a stock’s exposure to market risk (volatility). Before we go on, it’s worth noting that Warren Buffett pointed out in his 2014 letter to shareholders that ‘volatility is far from synonymous with risk.’ Having said that, beta can still be rather useful. The first thing to understand about beta is that the beta of the overall market is one. A stock with a beta below one is either less volatile than the market, or more volatile but not corellated with the overall market. In comparison a stock with a beta of over one tends to be move in a similar direction to the market in the long term, but with greater changes in price.
View our latest analysis for Patrick Industries
What does PATK’s beta value mean to investors?
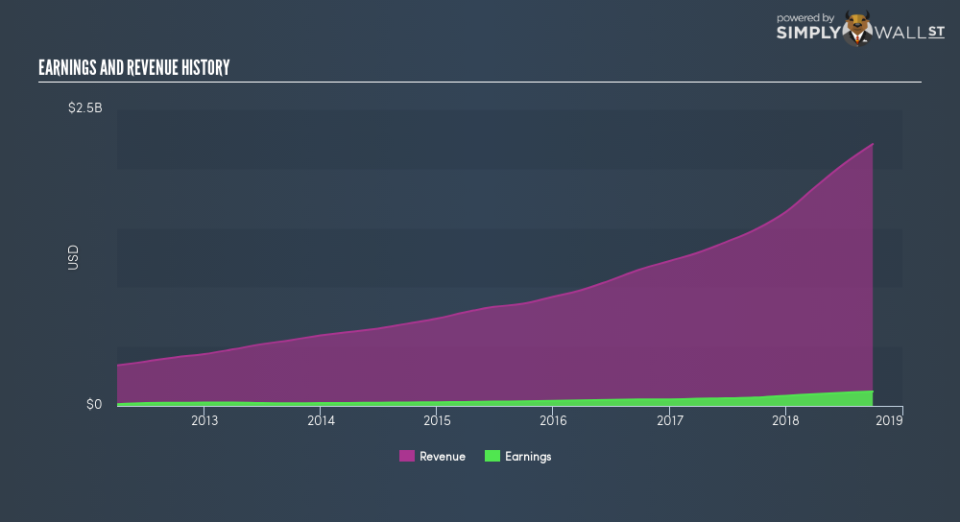
Looking at the last five years, Patrick Industries has a beta of 1.48. The fact that this is well above 1 indicates that its share price movements have shown sensitivity to overall market volatility. Based on this history, investors should be aware that Patrick Industries are likely to rise strongly in times of greed, but sell off in times of fear. Share price volatility is well worth considering, but most long term investors consider the history of revenue and earnings growth to be more important. Take a look at how Patrick Industries fares in that regard, below.
Could PATK’s size cause it to be more volatile?
Patrick Industries is a small cap stock with a market capitalisation of US$934m. Most companies this size are actively traded. It is quite common to see a small-cap stock with a beta greater than one. In part, that’s because relatively few investors can influence the price of a smaller company, compared to a large company.
What this means for you:
Since Patrick Industries has a reasonably high beta, it’s worth considering why it is so heavily influenced by broader market sentiment. For example, it might be a high growth stock or have a lot of operating leverage in its business model. This article aims to educate investors about beta values, but it’s well worth looking at important company-specific fundamentals such as Patrick Industries’s financial health and performance track record. I urge you to continue your research by taking a look at the following:
Future Outlook: What are well-informed industry analysts predicting for PATK’s future growth? Take a look at our free research report of analyst consensus for PATK’s outlook.
Past Track Record: Has PATK been consistently performing well irrespective of the ups and downs in the market? Go into more detail in the past performance analysis and take a look at the free visual representations of PATK’s historicals for more clarity.
Other Interesting Stocks: It’s worth checking to see how PATK measures up against other companies on valuation. You could start with this free list of prospective options.
To help readers see past the short term volatility of the financial market, we aim to bring you a long-term focused research analysis purely driven by fundamental data. Note that our analysis does not factor in the latest price-sensitive company announcements.
The author is an independent contributor and at the time of publication had no position in the stocks mentioned. For errors that warrant correction please contact the editor at editorial-team@simplywallst.com.
