
 Yahoo Finance
 Ollie's Bargain (OLLI) Q2 Earnings & Sales Top, FY18 View Up

Ollie's Bargain Outlet Holdings, Inc.’s OLLI sustained its remarkable streak of positive earnings and sales surprises in the second quarter of fiscal 2018 as well. The company also continued with its decent year-over-year improvement in both the top and bottom lines, while reporting 17th successive quarter of comparable-store sales growth. Consequently, better-than-expected results buoyed management to raise fiscal 2018 view.
Notably, the company’s impressive performance and strategic endeavors have helped this Zacks Rank #3 (Hold) stock to surge roughly 47% in the past six months compared with the industry’s growth of 2%.
Ollie’s Bargain delivered quarterly earnings of 40 cents a share beating the Zacks Consensus Estimate of 37 cents. The figure also surged 48.1% from the year-ago period. Net sales of $288.1 million also came ahead of the consensus mark of $284.6 million and rose 13.1% year over year. The year-over-year increase in top line can be attributable to 12.8% jump in the number of stores and 4.4% growth in comparable-store sales on account of increase in average basket size.
Notably, electronics, housewares, lawn and garden, automotive and floor coverings were the best performing categories.
Gross profit rose 12.4% to $112.6 million, however, gross margin contracted 30 basis points to 39.1% on account of increase in supply chain costs as a percentage of net sales, partly offset by higher merchandise margin. Operating income also soared 16.9% to $34.9 million, while operating margin expanded 40 basis points to 12.1% due to effective cost management and leveraging of SG&A expenses.
Adjusted EBITDA grew 15.4% to $40.3 million during the reported quarter, while adjusted EBITDA margin increased 30 basis points to 14%.
Ollie's Bargain’s business model of “buying cheap and selling cheap”, cost-containment efforts, focus on store productivity, sturdy comparable-store sales performance and expansion of customer reward program, Ollie's Army, fortify its position. These initiatives positioned the stock to augment both its top and bottom-line performance in the long run.
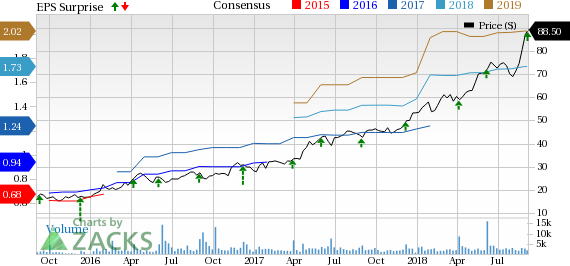
Ollie's Bargain Outlet Holdings, Inc. Price, Consensus and EPS Surprise
Ollie's Bargain Outlet Holdings, Inc. Price, Consensus and EPS Surprise | Ollie's Bargain Outlet Holdings, Inc. Quote
Store Update
During the quarter under review, the company opened six outlets and entered one new state — Louisiana. The company ended the quarter with a total of 282 stores in 22 states, reflecting an increase of 12.8% year over year. Management plans to open 36-38 new stores and relocating one during fiscal 2018. The company expects to take the store count to more than 950.
Financial Aspects
Ollie’s Bargain ended the reported quarter with cash and cash equivalents of $29.4 million, total debt (including the current portion) of about $21.7 million, and shareholders’ equity of $860.2 million. The company incurred capital expenditures of $5.5 million during the quarter. Management now anticipates capital expenditures in the range of $70-$75 million during fiscal 2018 due to the recent buyout of 12 former Toys “R” Us properties.
Guidance
Management now forecasts fiscal 2018 net sales in the band of $1.222-$1.227 billion, up from its previous projection of $1.207-$1.215 billion. Ollie's Bargain anticipates comparable-store sales growth of 2.5-3% up from 1-2% expected earlier. The company now envisions adjusted earnings in the band of $1.73-$1.76, up from its prior forecast of $1.69-$1.72 per share. The Zacks Consensus Estimate of for the fiscal year is pegged at $1.73.
Operating income is expected to be in the range of $154-$156 million for the fiscal year, up from $152-$154 million projected previously. Management continues to envision fiscal 2018 gross margin to be 40.1%. The company expects 30-40 basis points contraction in gross margin during the third quarter and a 30-40 basis points improvement in the final quarter.
3 Hot Stocks Awaiting Your Look
Burlington Stores BURL delivered an average positive earnings surprise of 11.4% in the trailing four quarters. It has a long-term earnings growth rate of 20.2% and a Zacks Rank #2 (Buy). You can see the complete list of today’s Zacks #1 Rank (Strong Buy) stocks here.
Target Corporation TGT delivered an average positive earnings surprise of 1.3% in the trailing four quarters. It carries a Zacks Rank #2.
The TJX Companies TJX delivered an average positive earnings surprise of 7.3% in the trailing four quarters. It has a long-term earnings growth rate of 10.6% and a Zacks Rank #2.
The Hottest Tech Mega-Trend of All
Last year, it generated $8 billion in global revenues. By 2020, it's predicted to blast through the roof to $47 billion. Famed investor Mark Cuban says it will produce ""the world's first trillionaires,"" but that should still leave plenty of money for regular investors who make the right trades early.
See Zacks' 3 Best Stocks to Play This Trend >>
Want the latest recommendations from Zacks Investment Research? Today, you can download 7 Best Stocks for the Next 30 Days. Click to get this free report
Ollie's Bargain Outlet Holdings, Inc. (OLLI) : Free Stock Analysis Report
The TJX Companies, Inc. (TJX) : Free Stock Analysis Report
Target Corporation (TGT) : Free Stock Analysis Report
Burlington Stores, Inc. (BURL) : Free Stock Analysis Report
To read this article on Zacks.com click here.
Zacks Investment Research
