
 Yahoo Finance
 OceanaGold (TSE:OGC) Will Want To Turn Around Its Return Trends
Did you know there are some financial metrics that can provide clues of a potential multi-bagger? One common approach is to try and find a company with returns on capital employed (ROCE) that are increasing, in conjunction with a growing amount of capital employed. Basically this means that a company has profitable initiatives that it can continue to reinvest in, which is a trait of a compounding machine. In light of that, when we looked at OceanaGold (TSE:OGC) and its ROCE trend, we weren't exactly thrilled.
Understanding Return On Capital Employed (ROCE)
For those that aren't sure what ROCE is, it measures the amount of pre-tax profits a company can generate from the capital employed in its business. To calculate this metric for OceanaGold, this is the formula:
Return on Capital Employed = Earnings Before Interest and Tax (EBIT) ÷ (Total Assets - Current Liabilities)
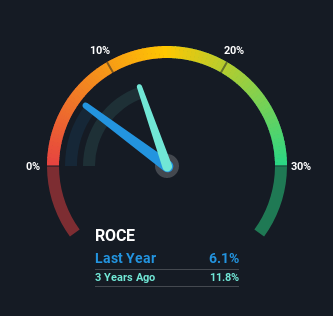
0.061 = US$131m ÷ (US$2.3b - US$180m) (Based on the trailing twelve months to September 2021).
Thus, OceanaGold has an ROCE of 6.1%. In absolute terms, that's a low return but it's around the Metals and Mining industry average of 5.3%.
View our latest analysis for OceanaGold
In the above chart we have measured OceanaGold's prior ROCE against its prior performance, but the future is arguably more important. If you'd like to see what analysts are forecasting going forward, you should check out our free report for OceanaGold.
What Does the ROCE Trend For OceanaGold Tell Us?
When we looked at the ROCE trend at OceanaGold, we didn't gain much confidence. Over the last five years, returns on capital have decreased to 6.1% from 8.4% five years ago. However, given capital employed and revenue have both increased it appears that the business is currently pursuing growth, at the consequence of short term returns. And if the increased capital generates additional returns, the business, and thus shareholders, will benefit in the long run.
The Key Takeaway
In summary, despite lower returns in the short term, we're encouraged to see that OceanaGold is reinvesting for growth and has higher sales as a result. These growth trends haven't led to growth returns though, since the stock has fallen 43% over the last five years. As a result, we'd recommend researching this stock further to uncover what other fundamentals of the business can show us.
On a final note, we've found 1 warning sign for OceanaGold that we think you should be aware of.
For those who like to invest in solid companies, check out this free list of companies with solid balance sheets and high returns on equity.
Have feedback on this article? Concerned about the content? Get in touch with us directly. Alternatively, email editorial-team (at) simplywallst.com.
This article by Simply Wall St is general in nature. We provide commentary based on historical data and analyst forecasts only using an unbiased methodology and our articles are not intended to be financial advice. It does not constitute a recommendation to buy or sell any stock, and does not take account of your objectives, or your financial situation. We aim to bring you long-term focused analysis driven by fundamental data. Note that our analysis may not factor in the latest price-sensitive company announcements or qualitative material. Simply Wall St has no position in any stocks mentioned.
