
 Yahoo Finance
 NZD/USD Forex Technical Analysis – Rally Stopped Short of .7204 to .7266 Resistance Zone
The New Zealand Dollar is trading lower late in the session on Friday as trader squared positions ahead of the weekend after driving the Forex pair into its highest level since March 22. The Kiwi was pressured during the session by a slight rebound in U.S. Treasury yields.
At 20:49 GMT, the NZD/USD is trading .7143, down 0.0027 or -0.38%.
Daily Swing Chart Technical Analysis
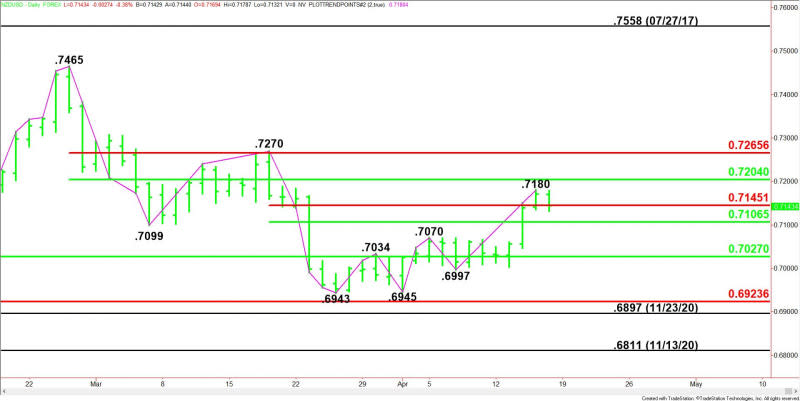
The main trend is up according to the daily swing chart. A trade through .7180 will signal a resumption of the uptrend. A move through .6997 will change the main trend to down.
The minor trend is also up. A new minor top was formed at .7180.
The main range is .7465 to .6943. Its retracement zone at .7204 to .7266 is potential resistance. This zone is also controlling the near-term direction of the NZD/USD.
The short-term range is .7270 to .6943. The Forex pair is currently trading on the strong side of its retracement zone at .7145 to .7106. This is helping to generate a slight upside bias. It’s also potential support.
The major support is the retracement zone at .7027 to .6924. This zone stopped the selling at .6945 and .6943 on April 1 and March 25, respectively.
Short-Term Outlook
The direction of the NZD/USD into the close on Friday will be determined by trader reaction to the short-term Fibonacci level at .7145.
Bullish Scenario
A sustained move over .7145 will indicate the presence of buyers. The first target is the minor top at .7180. Taking out this level could extend the rally into the main retracement zone at .7204 to .7266. Look for sellers on the first test of this zone. Overcoming .7266 could trigger an acceleration to the upside.
Bearish Scenario
A sustained move under .7145 will signal the presence of sellers. This could trigger a late session drop into the short-term 50% level at .7106. This is a potential trigger point for an acceleration to the downside.
For a look at all of today’s economic events, check out our economic calendar.
This article was originally posted on FX Empire
More From FXEMPIRE:
Crude Oil Weekly Price Forecast – Crude Oil Markets Have Strong Week
Silver Weekly Price Forecast – Silver Markets Form Bullish Candle
Natural Gas Weekly Price Forecast – Natural Gas Continues Choppy Behavior
The Weekly Wrap – Economic Data, COVID-19 Vaccine News, and Geopolitics Were in Focus
USD/CAD Daily Forecast – Canadian Dollar Gains Ground Ahead Of The Weekend
