
 Yahoo Finance
 NZD/USD Forex Technical Analysis – Trend Down, but Time May Be Right for Short-Term Counter-Trend Move
The New Zealand Dollar tumbled last week, dragged down by an extremely weak Australian Dollar. The catalyst behind the selling pressure was expectations of another potential rate cut by the Reserve Bank of New Zealand later this year.
Stronger-than-expected U.S. economic data also drove the Kiwi lower as it dampened the chances of a U.S. recession and Fed rate cut, helping to widen the divergence in monetary policy between the central banks.
Last week, the NZD/USD settled at .6514, down 0.0085 or -1.29%.
Weekly Technical Analysis
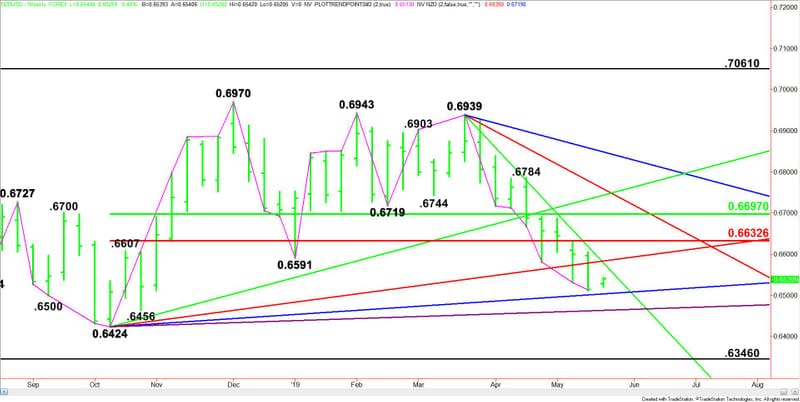
The main trend is down according to the weekly swing chart. The next downside targets are the minor bottom at .6456 and the main bottom at .6424.
The main trend will change to up on a move through .6939. This is highly unlikely however. The NZD/USD is down nine weeks since its last main top so traders should start watching for a counter-trend closing price reversal bottom.
The minor top is .6784. A trade through this level will change the minor trend to up. This will shift momentum to the upside.
The main range is .6424 to .6970. Its retracement zone at .6633 to .6697 is resistance. This zone is controlling the near-term direction of the NZD/USD.
Weekly Technical Forecast
Based on last week’s price action and the prolonged move down in terms of price and time, the direction of the NZD/USD this week is likely to be determined by trader reaction to last week’s low at .6513.
Bearish Scenario
Taking out .6513 will indicate the presence of sellers. The first target is an uptrending Gann angle at .6504. If this angle fails as support then look for the selling to possibly extend into the minor bottom at .6456, followed by another uptrending Gann angle at .6464. This is the last potential support angle before the .6424 main bottom. If .6424 is taken out with conviction then look for the selling to possibly extend into the next main bottom at .6346.
Bullish Scenario
Holding above .6513 will signal the presence of buyers. If this creates enough upside momentum then look for a rally into the downtrending Gann angel at .6579, followed closely by an uptrending Gann angle at .6584. If this move creates enough upside momentum then look for the rally to possibly extend into the Fibonacci level at .6633.
Closing Price Reversal Bottom Set-Up
Taking out .6513 then recovering last week’s close at .6514 will put the NZD/USD in a position to form a potentially bullish closing price reversal bottom. If confirmed this could lead to a 2 to 3 week counter-trend rally. The chart pattern is not likely to lead to a change in trend, but it will indicate the buying is greater than the selling at current price levels.
This article was originally posted on FX Empire
More From FXEMPIRE:
Monero Technical Analysis – Support Levels in Play – 20/05/19
Aussie Shorts Bracing for Higher Opening Amid Surprise Election Results
EUR/USD Daily Price Forecast – Fiber Might Find Support Near 1.1135 Monthly Lows
Brent Crude Oil Price Update – Holding Above $71.31 Puts Market in Bullish Position
European Equities: It’s All Eyes and Ears on the Oval Office. What’s Next?
Aussie Dollar is Worst G10 Currency So Far in May, Leading Up to Weekend’s Elections
