
 Yahoo Finance
 NZD/USD Forex Technical Analysis – Weekly Trend Down, Trading on Weak Side of Major Retracement Zone
The New Zealand Dollar finished sharply lower last week with most of the selling fueled by a dovish Reserve Bank monetary policy statement. The currency broke sharply late last week after the RBNZ signaled that it was not likely to raise its benchmark interest rate until 2020. The shedding of higher-yielding currencies due to risk aversion also contributed to the sell-off.
Last week, the NZD/USD settled at .6577, down 0.0171 or -2.53%.
Weekly Swing Chart Technical Analysis
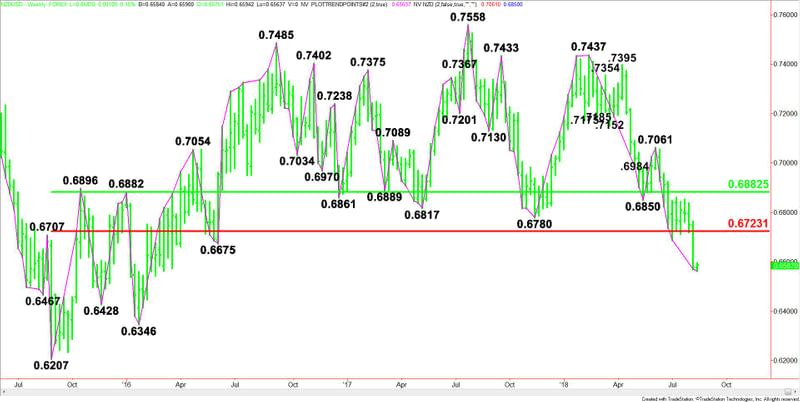
The main trend is down according to the weekly swing chart. After four weeks of consolidation, the NZD/USD took out the bottom at .6688 from the week-ending July 6, signaling a resumption of the downtrend. Sellers also took out the bottom at .6675 from the week-ending June 3, reaffirming the downtrend.
The main range is .6207 to .7558. Its retracement zone is .6882 to .6723. Closing below this zone is also helping to give the Forex pair a downside bias. The retracement zone is new resistance.

Weekly Swing Chart Technical Forecast
The week starts with the NZD/USD down 10 weeks from its last main top at .7061. This puts it in the window of time for a closing price reversal bottom. The chart pattern will not indicate a change in trend, but it could signal the start of a 2 to 3 week counter-trend rally.
Due to the prolonged move down in terms of price and time and the possibility of a closing price reversal bottom, the direction of the NZD/USD this week is likely to be determined by trader reaction to last week’s close at .6577.
A sustained move under .6577 will indicate the presence of sellers. This could produce another acceleration to the downside since the next target is .6346.
A sustained move over .6577 will signal the presence of buyers. This could be profit-taking or aggressive counter-trend buying. The nearest resistance is the long-term Fibonacci level at .6723.
This article was originally posted on FX Empire
