
 Yahoo Finance
 NuStar Energy (NS) Q4 Earnings Beat Estimates, Soar Y/Y
NuStar Energy’s NS fourth-quarter 2019 earnings and sales surpassed the Zacks Consensus Estimate. The partnership posted adjusted earnings per unit of 40 cents, higher than the Zacks Consensus Estimate of 38 cents. Strong contribution from pipeline and storage units can be attributed to the impressive performance.
Moreover, the bottom line skyrocketed 344.4% from the year-ago income of 9 cents a unit on the back of solid operations from the Pipeline segment amid expanded throughput volumes from crude oil pipelines.
Quarterly revenues of $399.6 million outpaced the Zacks Consensus Estimate of $381 million. However, the top line was 21.5% below the year-ago level of $509 million due to lower fuel sales.
While the firm’s revenues declined year over year, NuStar’s operating income increased from $86.6 million to $124.05 million in the quarter under review. This upside was driven by lower costs and expenses amounting to $275.6 million, down from the year-earlier level of $287.4 million. Notably, cost of product sales fell 29.9% from the prior-year quarter to $68.19 million.
NuStar Energy L.P. Price, Consensus and EPS Surprise
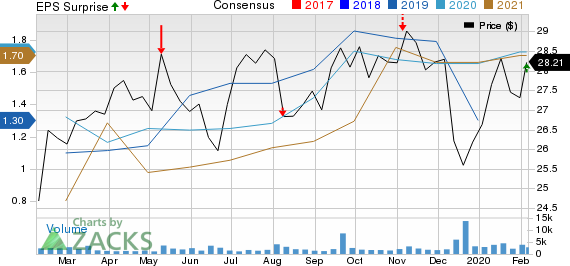
NuStar Energy L.P. price-consensus-eps-surprise-chart | NuStar Energy L.P. Quote
Segmental Performance
Pipeline: Total quarterly throughput volumes were 2,064,289 barrels per day (Bbl/d), up 35.6% from the year-ago period. Throughput volumes from crude oil pipelines jumped 52.5% (primarily owing to higher contribution from the Permian crude system) from the year-ago quarter to 1,462,784 Bbl/d while throughput from refined product pipelines witnessed a nominal increase to 601,505 Bbl/d from 562,773 Bbl/d. As a result, the segment’s revenues rose 20.32% year over year to $194 million. Concurrently, operating income of $98.6 million was up from the year-ago figure of $74.9 million.
Storage: Throughput volumes rose to 656,000 Bbl/d from 354,567 Bbl/d in the prior-year quarter. The unit’s quarterly revenues increased to $126.3 million from $107.4 a year ago owing to surging throughput terminal revenues (from $21.8 million to $43 million). However, operating expenses of the firm increased from $49.1million in the year-ago quarter to $55.4 million. The segment’s operating income came in at $45.8 million compared with $34.6 million in the corresponding quarter of 2018.
Fuels Marketing: Product sales decreased to $79.4 million from $105.6 million in the year-ago quarter. On a positive note, cost of goods dropped 30.17% from the prior-year period to $67.5 million. The segment recorded earnings of $11.2 million in the quarter under review compared with $8.3 million in fourth-quarter 2018.
Cash Flow, Debt and Guidance
Fourth-quarter 2019 distributable cash flow available to limited partners was $107million (providing 1.33x distribution coverage), higher than $84 million in the year-ago period.
As of Dec 31, the partnership’s total consolidated debt was $3360.6 million.
The firm continues to anticipate 2020 adjusted EBITDA in the band of $715-$765 million. Income from continuing operations for the full year is expected in the range of $233-$258 million. It expects to exit the ongoing year with approximately 550,000 bpd.
Zacks Rank & Other Key Picks
NuStar carries a Zacks Rank #2 (Buy). Other top-ranked players in the energy space include Marathon Oil Corporation MRO, Chevron Corporation CVX and TC Energy Corporation TRP, each carrying a Zacks Rank of 2. You can see the complete list of today’s Zacks #1 Rank (Strong Buy) stocks here.
More Stock News: This Is Bigger than the iPhone!
It could become the mother of all technological revolutions. Apple sold a mere 1 billion iPhones in 10 years but a new breakthrough is expected to generate more than 27 billion devices in just 3 years, creating a $1.7 trillion market.
Zacks has just released a Special Report that spotlights this fast-emerging phenomenon and 6 tickers for taking advantage of it. If you don't buy now, you may kick yourself in 2020.
Click here for the 6 trades >>
Want the latest recommendations from Zacks Investment Research? Today, you can download 7 Best Stocks for the Next 30 Days. Click to get this free report
NuStar Energy L.P. (NS) : Free Stock Analysis Report
Chevron Corporation (CVX) : Free Stock Analysis Report
TC Energy Corporation (TRP) : Free Stock Analysis Report
Marathon Oil Corporation (MRO) : Free Stock Analysis Report
To read this article on Zacks.com click here.
Zacks Investment Research
